Thursday, October 29, 2015

Two-child China, and population ageing myths

China abandoned its one-child policy yesterday. Just about everything I’ve read since explains that this policy shift is a result of fears about dependency ratios; the ratio of the number of non-working age people in the population (children and the elderly) to the number of working age people. As shown in the chart below, China, like most countries, is seeing the start of an uptick in this ratio due to an ageing population.


But the simple fact is that increasing fertility rates isn’t a solution to this problem.

The reason population growth doesn’t solve this problem is that a growing population relies on
  1. more children, and hence a higher youth dependency ratio, or
  2. more immigrants, who both reproduce (more children) and become elderly themselves. 
The only way population growth can ‘solve’ the age dependency problem is if the growth rate itself continues to grow in a grand human Ponzi scheme.

To make this point clear I have poached the data from a great study way back in 1999 by Peter McDonald and Rebecca Kippen. They simulate a number of Australian population scenarios that represent some of the political views at the time ranging from Harry Recher’s view of a one-child policy coupled with zero immigration, to Tim Flannery’s view that a sustainable long-term population target is 12 million, to Jeff Kennett’s view that immigration should be ratcheted up as far as necessary to maintain a constant dependency ratio.

I show in the graph below the dependency ratio[1] based on the various population projections in their simulations (final populations in 2100 are in brackets).


A few things should be noted.

First, the lowest population projection, the Recher model, gets Australia’s population to 5 million by the end of the century and reaches a peak dependency ratio (DR) of about 2.2. The highest population projection, the Kennett immigration solution, reaches a population of 929.5 million (yes, a billion) in 2100, relying on a population growth rate of over 4% to keep the DR at its 1998 level of about 0.7.

In between these two extremes we have population paths that lead to populations between 12 and 50 million by the end of the century, all of which result in a DR between 1 and 1.5 by this measure.

But here’s the thing. That 0.5 difference in the DR between the radically high and low population projections, can be totally offset by changing the retirement age by just two years - shifting the population at age 65 and 66 from dependent to working age.

At the moment the Australia pension age is shifting two years - from age 65 to 67. If social norms of employment change to accompany this, any ageing problem is already solved.

In short, what seem like insurmountable demographic shifts are actually relatively slow and minor changes in economic terms. Not only does a declining youth dependency ratio offset much of the increase in the age-dependency ratio, but from the perspective of the economy as a whole the potential costs of ageing are minor compared the economic and environmental costs associated with rapid population growth necessary to suppress this ratio.

[1] In these scenarios the dependency ratio is weighted so that a child accounts for 3/4 of a person, and a retired older person (above age 60) accounts for 5/4 of a person.

Sunday, October 25, 2015

Queensland will ignore better planning

I wrote a submission during the consultation on reforms to the Queensland planning system. As you are probably aware, my research in this area focusses mostly on teasing out statistically the amount of favouritism happening in high value rezoning decisions.

My submission also focuses on the scope within the proposed Planning Bill for continued favouritism. But I also raise the point that we should enshrine at the highest level that governments of all levels, from Councils upwards, be able to capture the land value created by their planning decisions. As it stands the Bill suggests the opposite should be the case - that Councils are liable for compensation should they downgrade the value of land uses at a location (subject to the land being currently used for that purpose).

In no other area of government do we give away property rights for free, so often. It's a multi-billion dollar annual ritual of gift-giving from the public to politicly-connected landowners.

If you want to listen to a terrific podcast covering the types of mechanisms available to recover value gains from government policy I recommend last week’s Renegade Economist episode, which is the source of the below image as well.

You can download my submission here.


Saturday, October 24, 2015

Explaining everything explains nothing: Economics

The below comic probably hits a little close to home for most economists. Poking fun of economists’ naive attachment to their particular brand of rationality, and it’s immense body of hidden assumptions, usually gains responses that are merely signals of tribal loyalties and ignore the substance of the critique.

My colleague Vera te Velde made an improvement on the comic which is also included below, and my reading is that she wants to gain loyalty from the tribe more than defend rationality assumptions in economic models.

While it is certainly true that her improvement is consistent with core economic theories, it really highlights in my mind that these theories are essentially vacuous if they can explain anything and everything imaginable.

In response to the ability of other economists to fit everything within their model (meaning nothing can be excluded), simply because of creatively reversing out a set of preferences that explain the observed behaviour (or as Vera concludes De gustibus non eat disputandum), I wrote
There was simply no phenomena he could not explain with his beloved utility theory. But if the theory explains everything imaginable, then it predicts nothing. I resolved that the theory as it stands, in the revealed preference form, was not falsifiable, though he didn’t seem to understand why that would matter.  
Sure, humans often make calculated decisions, but the more I learn about the nexus between individual behaviour and how we behave in groups, the more I see very little value in rational-individualist views of economic systems that see all behaviour arising from God-given personal tastes. Without acknowledging the necessity of group-coordination mechanisms intrinsic in our behaviour, we are missing the main story.

Wednesday, September 30, 2015

How to analyse housing markets

Housing costs are typically 30% of household income, while about 43% of household savings are tied up in the value of owner-occupied dwellings. There is really no more important market for the general public to understand when it comes to their cost of living and their ability to save for the future.

But simply talking about the housing market as if it is some monolithic beast will lead you to the error of conflating three distinct markets that must be considered independently to truly understand what is happening. These markets are
  1. The land/property asset market
  2. The housing service market (annual occupancy from rent or ownership)
  3. The residential construction market
When you buy a home on the second-hand market (rather than build yourself), you are actually buying a bundled good which includes a land asset along with a durable housing product that lasts the life of the building. A close analogy would be buying a car bundled with an equity share in the vehicle manufacturer—you get the vehicle for its useful life and the equity asset in perpetuity.

So when we talk of high demand for housing, home prices increasing, and housing bubbles, we must be clear about whether we are 1) talking about the market for the land asset component of the bundled housing good, or 2) referring to the housing service market for occupying homes. Conflating these two markets is the most common error in housing market analysis and leads to conclusions that make little sense.

For example, take the frequent comments about the effect of population growth on home prices. To me, it is utterly confusing. If we are talking about the land asset market, the question then arises about why we don’t talk about the population effects on equity and debt markets, derivatives markets, and other asset classes that could equally see effects. Why would "new" people be willing to pay more for the same asset?

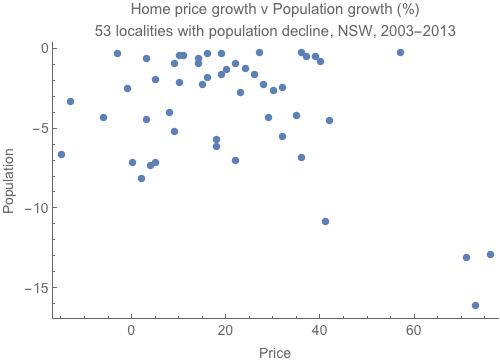
You can see from the graph below that population effects don’t seem to be a major driver of land asset price growth. Areas with a 10-15% population declines have still seen 70% growth in home prices.

Like other asset markets, the reason land prices increase has a lot to do with the reduction of interest rates in the past 20 years. Asset prices are just the capitalised value of future claims on incomes, so a lower interest rate increases that asset value compared to the value of that future income flow. This means that comparing prices of the bundle of house and land asset to incomes makes no sense at all. It would make just as much sense to compare the price of an equity share in Woolworths bundled with a kilo of bananas as a way to measure food inflation. Why not measure the food itself?

Luckily, we do have a market for housing as a produced good that we consume on an annual basis quite apart from the land asset; the rental market. If we measure how much of our incomes we spend on rent, and the quality of the homes we reside in (in terms of area per person), we can apply the supply and demand model to the market. If there really is something going on with population and housing production, it must be observable in the rental market. Looking at the chart below we can see that the rent-to-income ratio declined all the way through the land price boom of the early 2000s. So too did the occupancy rate (fewer people per home) indicating that in Australia more new homes were built than needed to house the new people to the same standard.


So sure, use your supply and demand analysis on the market for produced durable housing goods, but remember that home prices are not the price in that market. Rents are the price in the housing market, while home prices mostly reflect asset prices of the land market.

Lastly, we can look at the construction market, which is driven by trends in other markets, including speculation on land markets. Here the supply and demand approach also works, as periods of high demand for new construction result in increasing construction prices (as demand shift to the right against a resource-constrained upward-sloping supply curve for construction services). But again, the construction market and construction prices are not the main contributor to growth in home prices. In fact, higher construction costs will decrease the value of the land asset, as they provide an additional cost to capturing future income flows.

The situation now in Australia is that asset market dynamics, including lower interest rates, international buying by investors whose return is more than just financial (hence will buy with a lower yield), and simple cyclical timing of investments, are driving up land prices in some capital cities. In some areas, when this asset buying occurs in new homes it also increases demand for construction, pushing up prices in that market as well. But in the housing service (i.e. rental) market, the additional new home construction is suppressing rents.

This is the way to analyse housing markets. Don’t be drawn into the monolithic view by conflating behaviour in these distinct markets.