Wednesday, October 20, 2010

No limits to economic growth

For an environmental economist these words are blasphemous, but I said them, and I have good reason to. 

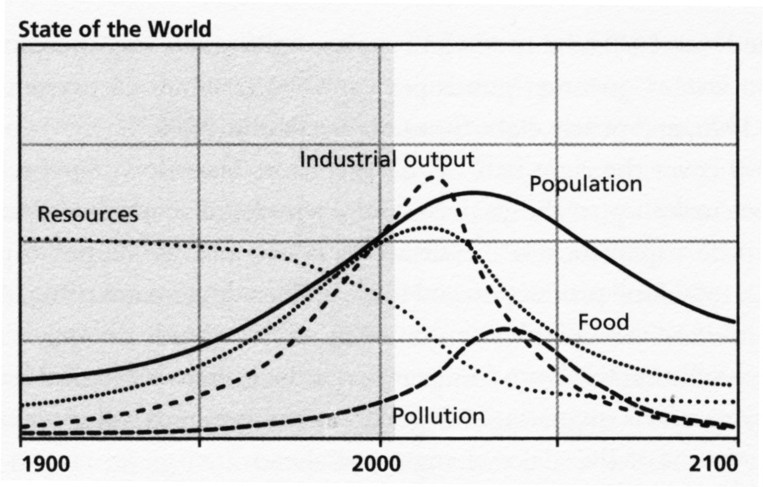
The modern Limits to Growth movement gained prominence with the publication of the Club of Rome’s book of the same name in 1972. This book, by Donella Meadows and colleagues, reports on the results of a computer simulation of the economy under the assumptions of finite resources. The World3 computer model produced scenarios showing that under various assumptions, a decline in non-renewable resources will lead to a decline in global food and industrial production, which will in turn lead to a decline in population and greatly reduced living standards for all. 

The following image is one example of the results of their simulations where a catastrophic decline in industrial output, food production and population will result form reaching our finite resource limits. 


While I don’t doubt the finitude of many natural resources, and that the human population cannot grow indefinitely, I doubt that finite limits of resource inputs to the economy necessarily means that economic growth cannot continue indefinitely.

To be sure, I am certain that substantial unforeseen changes to the rate of extraction of some resources will lead to short-term disruption of established production chains, such as shocks to oil supply, but in the long run I see no reason that an economy with finite resource inputs cannot increase production through improved technology and efficiency.

I need to be clear that when I talk of economic growth I mean our ability to produce more goods and services that we value for a given input. Increasing the size of the economy by simply having more people, each producing the same quantity of goods, will be measured as growth in GDP, but provides no improvement in the material well being of society.

A better measure of growth is real GDP per capita. This adjusts for the disconnection between the supply of money and the production of goods, and adjusts for the increase in scale provided by the extra labour inputs. Even then, this may overestimate the rate of real growth occurring, as there has been a trend of formalising much of the informal economy, for example child care, which is now a measured part of GDP rather than existing as individual family arrangements.

On these adjusted measures economic growth is a very slow process. In a world where non-renewable resource inputs are fixed or declining, it is the rate of the decline and the speed of adjustment that will determine the overall outcome for our well being. If the rate of decline of non-renewable resource inputs is below the rate of real growth (our ability to produce more with less) and the rate at which we can substitute to renewable alternatives, we can avoid economic calamity in the face of natural limits.

Unfortunately there are other factors at play.

The rate of population growth will greatly determine the per capita wellbeing in a time of limited growth. While extra labour input will no doubt contribute to production inputs, my suggestion is that this input will be outweighed by a decline in complementary resource inputs. Remember, we care about real economic ‘wealth’ per capita, and with more people there is a smaller share of remaining resources each person can utilise in production, thus reducing wellbeing.

Further, we can begin to take productivity gains as leisure time instead of more work time, thus there is a possibility of maintaining a given level of production in the economy with fewer labour inputs over time.

There is also the reliance of our financial system on high levels of growth. Many economic growth critics cite the need for exponential growth of financial measures of the economy as being in conflict with any finite system. Yet the ‘system’ itself is a human construction and I seen no reason why a stable money supply cannot operate under various levels of growth (even prolonged negative growth) if used cautiously and with little leverage.

Often forgotten is that many resources are currently fixed and yet go unnoticed. There are always 24 hours in a day, but that doesn’t stop us producing more each day. If a shortage of hours was encountered, would a sudden change to 23hrs (a 4% decline) have a dramatic impact? Or would society easily adjust to this new environment of tighter time scarcity?

While a smooth transition to prosperity under much greater limits on resource inputs to the economy is theoretically possible, I don’t expect this to be our future reality. Self interested governments, businesses and the general public will react to short term shocks in unexpected ways, potentially promoting conflict, and taking the bumpy road. I have no doubt that there will extended periods of prosperity in the future, but also expect a rough ride to get to them.

Monday, October 18, 2010

Counterintuitive findings?

Pool fences
Could Queensland’s new tougher pool fence laws offer an opportunity to study the Peltzman Effect? Will we now feel that pools are no longer a safety hazard for toddlers and drop our supervisory guard? One man, who refuses to comply with the laws, has argued this exact point and is strongly supported in his views (if you can trust the newspaper comments).

In one case, a pool owner living on a canal has had to fence their pool, yet is not obliged to fence off access to the canal.  One does wonder about how far governments can go to protect us from our own behaviour.

Pool fences are only there to protect kids from parents who don't. There are no fences around all the lakes in Brisbane, Southbank's lagoons are not fenced, the Brisbane River is not fenced. Why? Because we are responsible enough to ensure our children don't get into danger in these areas.

What further astounds me is that lack of evidence in the pool fence debate. In one of the more interesting studies I could find, 52% of pools where toddler drowning events had occurred in Western Australia where compliant with the pool fence legislation (compared to 40% for randomly selected pools).  There was no further discussion of this key point – that statistically it appears more likely to drown in a fenced pool that an unfenced one (I would be very interested if anyone can find a more thorough study of the effectiveness of pool fence laws).

While this is just a small sample from one State, and I would question whether general conclusions can be drawn, some more rigorous examination of the effectiveness of pool fence laws is seems appropriate before toughening the laws.  Is the government really going to do the same thing and expect different results?

Cycling by the road rules
The Council is inviting CityCycle subscribers to undertake a Cycling Confidence Course to improve their bicycle skills and brush up on their knowledge of road rules.

Maybe that's a bad idea. Recent research suggests that people obeying road rules are more likely to be killed by trucks than those who disobey the rules by, for example, running red lights. 

Women may be overrepresented in [collisions with goods vehicles] because they are less likely than men to disobey red lights.

By jumping red lights, men are less likely to be caught in a lorry driver’s blind spot. Cyclists may wait at the lights just in front of a lorry, not realising that they are difficult to see.

In more than half the fatal crashes, the lorry was turning left. Cyclists may be deceived by a lorry swinging out to the right to give itself room to make a left turn.

I can’t agree more with these findings.  Every day I see cyclists waiting in the blindspot of a car or truck at traffic lights, and occasionally see a cyclist sneak up the left side of a bus while it is turning left.  I hope Brisbane City Council’s cycling confidence course acknowledges that sometimes it is safer to break the rules.

Congestion (queuing) as an efficient allocation mechanism
I have raised the idea in the past that road congestion is in fact an efficient allocation mechanism provided that there is prior knowledge of expected travel times.  Now, from The Australian we have this:

Sure, if we invested enough in roads, all cars could travel at the speed limit. But the costs of thus expanding road capacity would greatly outweigh the value motorists place on the savings in time and discomfort.

Exactly the same applies to road charging. With charges set sufficiently high, remaining drivers could go at speeds rivalling the Melbourne grand prix. But even Mrs Moneybags, rocketing in her Ferrari, would not value the benefits enough to offset the welfare loss to the peons forced by the high charges to walk to work. Add to their loss the costs of implementing the road charging scheme and the efficiency loss is all the greater.

Wednesday, October 13, 2010

Murray-Darling Basin Plan: Despite extreme lobbying, you can’t take water that does not exist

The release of a guide to the Murray-Darling Basin Plan is receiving very poor media coverage. This headline – “Basin Authority holds its first public meeting” - is entirely misleading. The Authority had numerous meeting with stakeholders including water users, irrigation groups, farmers groups, local councils, and anyone else who could claim and interest for the past two years. There should be no surprises.

Another here – “As many as 130,000 jobs could be lost because of reduced water allocations in Victoria's fruit bowl region under the Murray-Darling Basin plan, a farmer says” That’s right. A farmer says so, therefore it must be true. 

This is a week the farming lobby has spent years preparing for, and they are basking the attention. 

The further problem which is completely overlooked by the media, is that while the reductions in rights to take water are ‘up to 37%’ that means that most reduction in most rivers are ‘between zero and 37%’. 

Let’s not also forget the fact that these are reductions of paper rights, not volume taken. There would be very few water users whose volume taken matches the volume of their rights due to variability and recent dry conditions.  The graph below shows that recent rainfall conditions are below historical averages, although this is not uncommon in the long term.


What is missing from this mainstream media nonsense is any actual thought about the reason the plan was developed in the first place. Simply put, there are more rights to take water ‘on paper’ than there is water in the system. This leads to both downstream water users suffering at the expense of upstream users, and environmental areas suffering due to upstream water users. When downstream environmental assets, such as wetlands, receive water, the water also flows through to downstream users. 

There is even the possibility that the next five years more water will be used by irrigators than the past five years, even with the Basin Plan, simply because of rainfall variability. The percentage figures are based on long run averages, which are a distant memory for many people in the Basin. 

Imagine I give you a piece of paper that allows you to take 100ML/annum of water from a particular reach of a river. The river flow is highly variable and because of this you get 60ML one year, zero the next three, 100ML the next, then 25ML. You average 31ML. Then, you get told the stream is overallocated and you are getting cut 37%, so that your allocation is now 63ML. If we had the previous six years again the impact would have only occurred in one year - the cut would take your five year average from 31ML to 25ML – a 20% decline in average use, and a once in five year impact. 

If over the next 5 years you can take 63ML, zero, 25ML, 50ML, 5ML and 60ML, you might end up with even more water on average – 34ML/a instead of 31ML/a – despite the theoretical cut to you water right.

In South Australia for example, irrigators have only been able to access 10% or less of their water rights over the past 5 years or so. If the Basin as a whole shares the water more equitably, these irrigators may be able to use 63% of their previous water allocation – a 37% cut on paper, but a 600% increase in real water use compared to the past 5 years. 

Even the MDBA itself showed just how low actual water use is compared to these theoretical baseline figures from which reductions are calculated. The graph below is from page 130 of the Guide and shows that the average water use since 2002-03 is equal to their most ambitious reduction scenario.


My point is, people are taking the cuts as real water then multiplying impacts to flow on industries then getting bigger and bigger impacts that border on ridiculous. These complementary agricultural industries are clearly already adjusted to any proposed cutbacks.

The only person to present any figures on the media circus is economist Quentin Grafton. He makes his case that farmers are exaggerating losses as follows: 

"In 2000-2001, the gross value of irrigated agricultural production was just over $5 billion, and they used surface water of about 10,500 gigalitres in that particular year," he says. 

"Fast forward to 2007-08, 70 per cent reduction in surface water use, guess what happened to the gross value of irrigated agricultural production? It changed by less than 1 per cent." 

Not only are impacts greatly overstated but water users will generally be compensated for their theoretical water loss at market prices for water – whether the water exists or not. 

Historically most water rights are a gift from the State to landholders. They have generally earned a good living from these gifts, and now that the government has realised that too many were granted, they are going to pay to buy them back. 

While I’m on the water bandwagon, some people are taking the chance to have a dig at cotton and rice growers for their water consumption. What they need to understand is that while Australia is a dry continent, we are characterised by variability of rainfall. Some years it floods and to make use of the water you need a thirsty annual crop. That’s why the virtual desert regions south of St George are cotton areas, even though this intuitively seems bizarre. 

Monday, October 11, 2010

WEIRD people: Western, Educated, Industrialised, Rich, Democratic... and unlike anyone else on the planet

The Ultimatum Game works like this: You are given $100 and asked to share it with someone else. You can offer that person any amount and if he accepts the offer, you each get to keep your share. If he rejects your offer, you both walk away empty-handed.

How much would you offer? If it's close to half the loot, you're a typical North American. Studies show educated Americans will make an average offer of $48, whether in the interest of fairness or in the knowledge that too low an offer to their counterpart could be rejected as unfair. If you're on the other side of the table, you're likely to reject offers right up to $40.

It seems most of humanity would play the game differently. Joseph Henrich of the University of British Columbia took the Ultimatum Game into the Peruvian Amazon as part of his work on understanding human co-operation in the mid-1990s and found that the Machiguenga considered the idea of offering half your money downright weird — and rejecting an insultingly low offer even weirder.

"I was inclined to believe that rejection in the Ultimatum Game would be widespread. With the Machiguenga, they felt rejecting was absurd, which is really what economists think about rejection," Dr. Henrich says. "It's completely irrational to turn down free money. Why would you do that?"
(here)

A recent paper by Dr Henrich and colleagues from the University of British Columbia investigates the psychological differences between WEIRD societies and other societies. In a deep examination of the literature, Henrich shows that while many basic similarities remain common to Homo sapiens, cultural factors play a large role in determining many psychological dispositions. Such differences occur when examining fairness, individualism and cooperation.

For me one standout finding was that the income maximising offer for the ultimatum game (discussed in the introductory quote) was a mere 10% of the total sum for most cultures in the review, while in typical WEIRD cultures a 50% offer was income maximising (see graph below).


So what environmental factors contribute to the difference?

Wednesday, October 6, 2010

Effective marginal tax rates and Australia’s welfare trap

Australia’s complicated social security system often leaves me baffled. There are so many forms of assistance for families, with rates of benefit and qualifying incomes changing annually, your entitlement (if any) is sometimes a lucky draw.

What I have noticed is the rate at which these benefits decline as the family income increases. So much so that I instinctively feel that earning a few extra dollars is generally not worth the trouble - unless of course my income was already high enough to be out of the qualifying range for family welfare benefits.

So I took the time to examine situation for Australian families, and it is quite revealing.

This recent paper, for example, shows that the effective marginal tax rate (EMTR), which estimates the change in take home income after tax and after accounting for reduced welfare payments, actually declines at higher income levels for almost every family type (see table below). High income families receive a greater percentage of an extra dollar earned than low income families, with middle income families suffering very high EMTRs.


For example, an extra dollar earned by a parent in a family with two dependent children and an income in the middle tax bracket will leave them with an extra 28c in the pocket, while for a high income family, they keep 67c out of any extra dollar.

There are even situations in Australia where the EMTR is greater than 100%! Low income families with dependents on youth allowance have an EMTR of around 110% - for every extra dollar earned, they get 10c less in their pockets.

Unfortunately, I fall into the group with the highest EMTR – families with dependents – where 15% of the group have EMTRs above 70%.

...families with children are more likely to face an EMTR of 50 to 70 per cent than other types of households, due to the accumulation of withdrawal rates for family related payments on top of income support withdrawal and income tax. This is observed even without including the withdrawal of childcare subsidies. On average, the EMTR is highest for couples with dependent children. (here)

After a quick bit of research, it appears that if I earn another dollar we lose 20c from family tax benefits, about 18c in the dollar from child care benefits, and 30c in tax – a 68% EMTR. If my wife earns an extra dollar we lose 40c in Family tax benefits (Part A and B combined), 18c of child care subsidies, and 15c in tax – a 73% EMTR.

In light of this outrageous situation, cutting down to part-time work (4 days/week) provides an extra 48days of leisure per year at a minimal cost to the family.

Also, if we factor in the extra expenses incurred due to extra work hours and time pressure – takeaway meals, remaining child care costs, driving instead of cycling, and splurging on treats because you deserve a reward at the end of a busy day, you quickly see the rational for staying in the welfare trap.

All this makes me wonder just how many families are trapped in high EMTR bands – all earning different incomes, but taking home much the same income ‘in the hand’.

Monday, October 4, 2010

Statistics lessons for property people

I have previously posted about the Property Council of Australia’s cowboy approach to statistics to argue for pro-sprawl planning policies on environmental grounds. Now Brian Stewart, CEO of the Urban Development Institute of Australia (UDIA) Queensland, needs a lesson in statistics.

In a recent bulletin to members he criticised the Local Government Association of Queensland’s interpretation of a report they commissioned on factors affecting home prices in South East Queensland.

He questions the conclusion that the AEC report commissioned by LGAQ refutes ‘for all time the spurious arguments of a so-called under-supply of dwellings in the SEQ market’. If he had paid attention in statistics it would be clear to him that this is exactly what the report does.

Although the report is far from an exemplary analysis of key determinants of residential property prices, the authors did estimate six econometric models to seek the determinants of real median house, unit and land prices in SEQ - eighteen models in total. If we quickly browse the report we find just one model, for house prices, not unit or land prices, where any of their supply-side variables is significant in explain real prices.

To be sure, Stewart’s interpretation of the report was poor, and his bulletin misleading, but I still have reservations about the report itself.

Particularly I have concerns about the choice of, and construction of, variables, including location bias in calculating the median prices and using ratios to total stock rather than sales volumes (particularly in the treatment of the FHOG). It seems odd that with 69 data points and 32 variables at hand they had trouble finding significant relationships in the data – could it be their selection was stacked with the wrong variables to explain prices?

One example of the construction of variable is ‘SEQ housing stock per capita’, which is total stock for SEQ at the beginning of the period at the beginning of the analysis (1991) of 734,126, less an allowance for depreciation (about 0.3%), plus new stock completed IN QUEENSLAND in the period. This variable then accumulates over time to represent the stock of housing.

I first hope that the new stock only includes new stock in the SEQ region and that this is a typo. Second, I can’t see how depreciating a dwelling is good accounting. What should be considered is a factor for demolitions, and it would be easy enough to estimate the demolition to new dwelling ratio based on past census data.

These types of errors abound.

Most importantly I wonder how this controversial variable could be negatively correlated with prices. In the section on housing stock (p13) it shows that dwelling stock per 100 people grew from 38.1 to 41.1 from 1991 to 2006, while real prices grew from around $100,000 to $250,000 in this period (below). Either a) the three other significant variables, the All Ordinaries, unemployment and mortgage rates, explained the most of the change, or b) the variable used in the analysis is the CHANGE IN dwelling stock per person, which was positive but declining over the period.

What is further surprising is the conclusion that the SEQ property market somehow behaves differently to other parts of the country. Given that the analysis failed to explain the behaviour of the SEQ residential property market at all (their final land price model on page 29 had seven variables but just two were significant), one wonders how such conclusions are drawn. I am happy for someone to explain why it is different here (cringe) if they have the evidence to support the statement.

Anyone looking to elastify the supply side should note the report concludes by noting how responsive supply has in fact been to prices:

...the lot stock for SEQ rose from 25,000 during the early part of the decade to reach 50,000 by December 2005 and has stabilised around 54,000 since September 2007. This progression follows the growth in land prices very closely, indicating that supply of undeveloped residential lots has responded to price signals.

Thursday, September 30, 2010

Common sense and the CityCycle launch


I am pretty sure no one in Brisbane has ever said they do not ride for want of a bicycle. Nevertheless, Campbell Newman has spent $10million of ratepayers money on hire bikes to solve this none existent problem.  

I could be argumentative and say that if access to bikes was a problem, you could have bought 20,000 of them for Brisbane residents for that price (at $500 each – 33,000 at $300 each). 

After a dramatic week repairing bike stations that were installed backwards, today, Brisbane’s CityCyle scheme was launched, with 500 bikes at 50 stations across the inner city.  To my surprise there were actually some people waiting to use the scheme today.

There are few optimists left in discussion of bike hire schemes in Australia. Melbourne’s scheme, for example, is not quite off to a roaring start – 0.5% utilisation or 70 trips per day after three months.  I could repeat myself and highlight that the success of this scheme depends on its convenience to users.  Helmet laws and lack of road space are key impediments to convenience. Indeed, I proposed that a car hire scheme would be a better way to encourage cycling.

Brisbane is trying to overcome the helmet problem by giving away 2000 of them, but Council admits the helmet requirement shrinks the potential user base.  Tourists are apparently they are not a target market for the scheme. 

Monday, September 27, 2010

Too good to be true environmental solutions

... roughly 42 percent of U.S. lighting energy (in Canada the fraction might even be a little higher) goes to incandescent bulbs. ...compact fluorescent lamps in all sorts of sizes and shapes that have roughly quadrupled efficiency -- 11 watts replacing 40, 18 watts replacing 75, and so on. They last about thirteen times as long as a regular light bulb; therefore each one of them saves you not only three quarters of the electricity, but also a dozen replacement bulbs and trips up the ladder. That more than pays for them, even though these things are rather expensive.

Think of such a compact bulb, with 14 watts replacing 75, as a 61 negawatt power plant. By substituting 14 watts for 75 watts, you are sending 61 unused watts -- or negawatts -- back to Hydro, who can sell the electricity saved to someone else without having to make it all over again. It is much cheaper to save the electricity than to make it -- and not only in thermal stations. It is cheaper for society to use these bulbs than to operate a Hydro plant, even if building the dam were to cost nothing. Each bulb has a net cost of minus several cents per kilowatt- hour, and no dam can compete with that! - The Negawatt Revolution 

The crackpot with a mo, Amory Lovins, wants people to be paid to not consume electricity as a way to promote energy efficiency and decrease the demand for energy. He has been pushing the negawatt bandwagon for twenty years, yet for all our dramatic increases in energy efficiency, we consume more energy than ever (or more correctly, we use more natural resources to generate more electricity, heat and motion than ever). 

The term negawatt describes the fact that in a capacity constrained electricity generation system, reduced energy consumption by one customer allows an increase in consumption by another customer. Without the reduced consumption by one customer, the increased consumption by the new customer would only have been possible by investing in new generation capacity. Thus, the energy saved is as good as energy generated - so much so that the energy generator could pay users to reduce their energy consumption.

From an engineering perspective there is little wrong with this concept. Unfortunately, an economic perspective reveals many flaws.

Sunday, September 26, 2010

Lessons for the RBA on their blunt instrument

RBA Governator Glenn "I''l be back - with higher interest rates" Stevens has been softening up the public for his next interest rate move. He warns that his toolkit contains only a blunt instrument, and we will all be affected. I guess if the only tool you have is a hammer, every problem looks like a nail.

... we only have one set of interest rates for the whole Australian economy; we do not have different interest rates for certain regions or industries. We set policy for the average Australian conditions. A given region or industry may not fully feel the strength or weakness in the overall economy to which the Bank is responding with monetary policy. In fact no region or industry may be having exactly the ‘average’ experience. It is this phenomenon that people presumably have in mind when they refer to monetary policy being a ‘blunt instrument.

I think poor old Glenn is taking his hammer to a screw.

While he wisely notes we have one set of interest rates, not one interest rate, he seems to ignore the fact that differentiation of interest rates on debt should reflect the risk for each particular loan. The problem for the RBA is that those who actually lend in the marketplace are failing to properly price the risk premium associated with their particular loans. Housing is surely a risky investment at the moment, yet interest rates do not reflect the risk premium.

The obvious alternative to shifting the whole set of interest rates is to better manage the risk premium rate for a particular industry of concern, or forcefully adjust risks taken with other measures to suit the rates adopted in that industry.

For example, if banks insist on lending for housing at relatively low interest rates, they can reduce risk by keeping lower LVRs and more conservative income estimates. If they won’t do it voluntarily, because they suffer from extreme moral hazard associated with guaranteed government bail-outs, maybe the RBA can seek to have banks better regulated with regards to housing loan risks, particularly qualifying income and LVRs.

At the moment increasing interest rates will simple increase the interest burden on current debts, high risk or not, decrease take up of borrowing for productive purposes, and fail to curb the mispricing of risk and crude lending criteria of housing loans with the major banks.

Thursday, September 23, 2010

What I have found interesting lately

Bizarre findings in advertising:
“...in a relaxed situation like TV watching, attention tends to be used mainly as a defence mechanism. If an ad bombards us with new information, our natural response is to pay attention so we can counter-argue what it is telling us. On the other hand, if we feel we like and enjoy an ad, we tend to be more trustful of it and therefore we don't feel we need to pay too much attention to it.
"The sting in the tail is that by paying less attention, we are less able to counter-argue what the ad is communicating. In effect we let our guard down and leave ourselves more open to the advertiser's message.
"The findings suggest that if you don't want an ad to affect you in this way, you should watch it more closely."
Responsible lending?
Genworth’s acting chief executive Paul Caputo said yesterday the group had relaxed its view on earnings from overtime and second jobs in loan serviceability calculations...
Caputo said: “We support loans up to 95 per cent LVR. One of the lessons of the global financial crisis is that where a borrower has skin in the game the behaviour is very different.
“I don’t think we will get back to underwriting 100 per cent LVR loans.
“Another factor is the National Credit Act. It would be hard to see how a 100 per cent LVR loan would fit into the responsible lending criteria.”
Why of course, lending 95% of inflated values to people who need second jobs and overtime pay to meet repayments on teaser mortgage rates epitomises responsible lending.  
Why are German home prices so stable? It is something they aspire to. Unlike Australia, where high prices are frowned upon everywhere except in housing.
Amazing graphic on the daily activities of Americans
Helmet laws back in the headlines - a good introduction to the debate
Leading indicators for the housing market - a website tracking advertising history to give up to the minute data on vendor discounting and days on market.
In the spirit of environmental month, a short must see video on global commercial air travel. What would be an economist environmentalist view?