I have previously posted about the Property Council of Australia’s cowboy approach to statistics to argue for pro-sprawl planning policies on environmental grounds. Now Brian Stewart, CEO of the Urban Development Institute of Australia (UDIA) Queensland, needs a lesson in statistics.
In a recent bulletin to members he criticised the Local Government Association of Queensland’s interpretation of a report they commissioned on factors affecting home prices in South East Queensland.
He questions the conclusion that the AEC report commissioned by LGAQ refutes ‘for all time the spurious arguments of a so-called under-supply of dwellings in the SEQ market’. If he had paid attention in statistics it would be clear to him that this is exactly what the report does.
Although the report is far from an exemplary analysis of key determinants of residential property prices, the authors did estimate six econometric models to seek the determinants of real median house, unit and land prices in SEQ - eighteen models in total. If we quickly browse the report we find just one model, for house prices, not unit or land prices, where any of their supply-side variables is significant in explain real prices.
To be sure, Stewart’s interpretation of the report was poor, and his bulletin misleading, but I still have reservations about the report itself.
Particularly I have concerns about the choice of, and construction of, variables, including location bias in calculating the median prices and using ratios to total stock rather than sales volumes (particularly in the treatment of the FHOG). It seems odd that with 69 data points and 32 variables at hand they had trouble finding significant relationships in the data – could it be their selection was stacked with the wrong variables to explain prices?
One example of the construction of variable is ‘SEQ housing stock per capita’, which is total stock for SEQ at the beginning of the period at the beginning of the analysis (1991) of 734,126, less an allowance for depreciation (about 0.3%), plus new stock completed IN QUEENSLAND in the period. This variable then accumulates over time to represent the stock of housing.
I first hope that the new stock only includes new stock in the SEQ region and that this is a typo. Second, I can’t see how depreciating a dwelling is good accounting. What should be considered is a factor for demolitions, and it would be easy enough to estimate the demolition to new dwelling ratio based on past census data.
These types of errors abound.
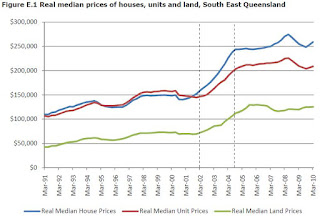
Most importantly I wonder how this controversial variable could be negatively correlated with prices. In the section on housing stock (p13) it shows that dwelling stock per 100 people grew from 38.1 to 41.1 from 1991 to 2006, while real prices grew from around $100,000 to $250,000 in this period (below). Either a) the three other significant variables, the All Ordinaries, unemployment and mortgage rates, explained the most of the change, or b) the variable used in the analysis is the CHANGE IN dwelling stock per person, which was positive but declining over the period.
What is further surprising is the conclusion that the SEQ property market somehow behaves differently to other parts of the country. Given that the analysis failed to explain the behaviour of the SEQ residential property market at all (their final land price model on page 29 had seven variables but just two were significant), one wonders how such conclusions are drawn. I am happy for someone to explain why it is different here (cringe) if they have the evidence to support the statement.
Anyone looking to elastify the supply side should note the report concludes by noting how responsive supply has in fact been to prices:
...the lot stock for SEQ rose from 25,000 during the early part of the decade to reach 50,000 by December 2005 and has stabilised around 54,000 since September 2007. This progression follows the growth in land prices very closely, indicating that supply of undeveloped residential lots has responded to price signals.

No comments:
Post a Comment