But simply talking about the housing market as if it is some monolithic beast will lead you to the error of conflating three distinct markets that must be considered independently to truly understand what is happening. These markets are
- The land/property asset market
- The housing service market (annual occupancy from rent or ownership)
- The residential construction market
So when we talk of high demand for housing, home prices increasing, and housing bubbles, we must be clear about whether we are 1) talking about the market for the land asset component of the bundled housing good, or 2) referring to the housing service market for occupying homes. Conflating these two markets is the most common error in housing market analysis and leads to conclusions that make little sense.
For example, take the frequent comments about the effect of population growth on home prices. To me, it is utterly confusing. If we are talking about the land asset market, the question then arises about why we don’t talk about the population effects on equity and debt markets, derivatives markets, and other asset classes that could equally see effects. Why would "new" people be willing to pay more for the same asset?
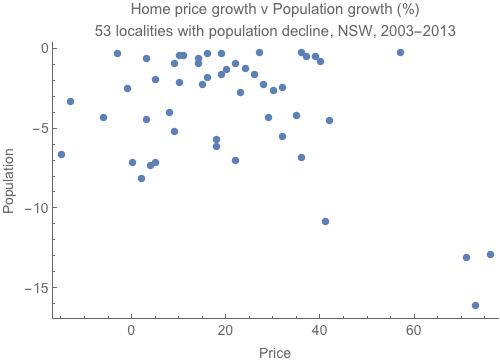
You can see from the graph below that population effects don’t seem to be a major driver of land asset price growth. Areas with a 10-15% population declines have still seen 70% growth in home prices.
Luckily, we do have a market for housing as a produced good that we consume on an annual basis quite apart from the land asset; the rental market. If we measure how much of our incomes we spend on rent, and the quality of the homes we reside in (in terms of area per person), we can apply the supply and demand model to the market. If there really is something going on with population and housing production, it must be observable in the rental market. Looking at the chart below we can see that the rent-to-income ratio declined all the way through the land price boom of the early 2000s. So too did the occupancy rate (fewer people per home) indicating that in Australia more new homes were built than needed to house the new people to the same standard.
So sure, use your supply and demand analysis on the market for produced durable housing goods, but remember that home prices are not the price in that market. Rents are the price in the housing market, while home prices mostly reflect asset prices of the land market.
Lastly, we can look at the construction market, which is driven by trends in other markets, including speculation on land markets. Here the supply and demand approach also works, as periods of high demand for new construction result in increasing construction prices (as demand shift to the right against a resource-constrained upward-sloping supply curve for construction services). But again, the construction market and construction prices are not the main contributor to growth in home prices. In fact, higher construction costs will decrease the value of the land asset, as they provide an additional cost to capturing future income flows.
The situation now in Australia is that asset market dynamics, including lower interest rates, international buying by investors whose return is more than just financial (hence will buy with a lower yield), and simple cyclical timing of investments, are driving up land prices in some capital cities. In some areas, when this asset buying occurs in new homes it also increases demand for construction, pushing up prices in that market as well. But in the housing service (i.e. rental) market, the additional new home construction is suppressing rents.
This is the way to analyse housing markets. Don’t be drawn into the monolithic view by conflating behaviour in these distinct markets.


