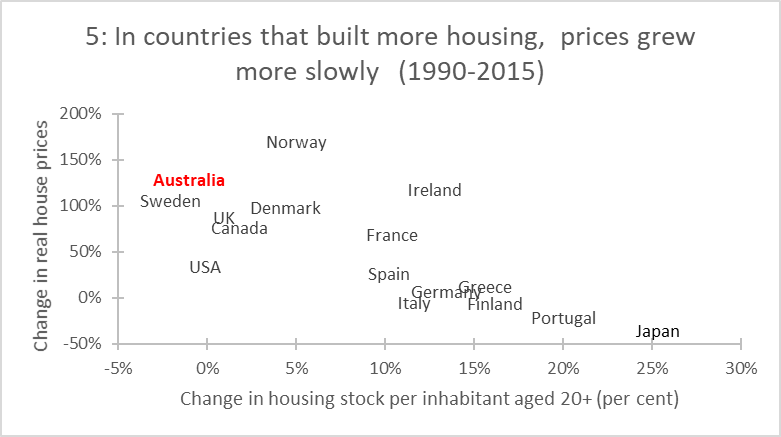
Not only is there an unjustified implication of direct causality (X causes Y, and planning regulations cause X), the pattern in the chart rests on choices about
- countries,
- time periods,
- measures of the housing stock, and
- measures of the price of housing.
...
Read the rest of this post at my new substack page and please subscribe there to get new posts to your email.
No comments:
Post a Comment