Glenn Stevens' address to the Economic Society of Australia in Brisbane yesterday reiterated the RBAs forecast of our future - Quarry Australia. Is that where we want to be?
The speech was full of useful analysis and commentary on domestic and global economic trends, but I have many concerns.
First, I'm not sure why the benefits of the mining boom are not spreading to the States with the largest mining investments. The Queensland government is broke yet still feels the need to stimulate the construction sector to the tune of $10,000 per new home. Further, if the property market is a good indicator of overall economic performance, the resource states seem to be taking a hammering. And by the way, the federal government stimulus is still ongoing, with
$2billion still to be spent even in June 2011. So the unstimulated state of the economy is yet to be seen in the data. I didn’t hear a peep about that.
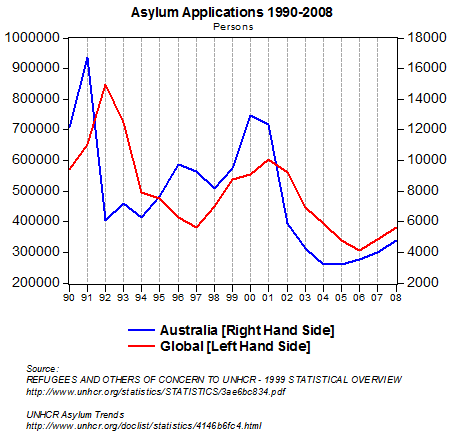
Stevens did raise the issue of falling home prices in Brisbane and Perth, suggesting that the reasons were all down to population growth and risk aversion by households. If we believe his population explanation for home price (
which is rubbish anyway), then we have to believe the whole country’s property market is due for a crash, with im
migration rates falling rapidly since mid 2008 (see chart below).
Some of his comments on housing follow, but the bolded sentence still confuses me. I could paraphrase - "the bank has no idea why Brisbane and Perth prices are down, but most likely it is because they were too high. We have no idea if prices elsewhere are also too high"
It surely is no coincidence that the two state capitals that have had the clearest evidence of declining house prices over the past couple of years – Brisbane and Perth – are the two that previously had the highest rate of population growth and that have since had the biggest decline in population growth. Moreover, it is hard to avoid the conclusion that changes in relative housing costs between states, while certainly not the only factor at work, have played an important role. Relative costs are affected by interstate population flows, but those costs then in turn have a feed-back effect on population flows. This is particularly so for Queensland.
...
The rate of interstate migration to Queensland then slowed further, to be at its lowest in at least a decade. The effects of that on state population growth were compounded by a decline in international migration, something seen in all states. At the same time, finance became more difficult to obtain and lenders and borrowers alike became more risk averse. This happened everywhere, but its effects in Queensland seem to have been more pronounced. Since then, Brisbane housing prices have been declining relative to those in the southern capitals and the construction sector here has found it tough going.
My other major concern is the following comment which is the justification for placing all of Australia’s bets on mining and energy.
For a long time, the world price of foodstuffs and raw materials tended to decline relative to the prices of manufactures, services and assets. But for some years now the prices of things that are grown, dug up or otherwise extracted have been rising relative to those other prices. This is mainly due to trends in global demand. At any point in time for a particular product we can appeal to supply-side issues – a drought, a flood or a mine or well closure, or some geo political event that is seen as pushing up prices. But stepping back, the main supply problem is really that there has simply been more demand than suppliers were prepared or able to meet at the old prices.
We do not have to look far for the cause: hundreds of millions of people in the emerging world have seen growth in their incomes and associated changes in their living standards, and they want to live much more like we have been living for decades. This means they are moving towards a more energy- and steel-intensive way of life and a more protein-rich diet. That fact is fundamentally changing the shape of the world economy. Even if China's growth rate moderates this year, as it seems to be doing, these structural forces almost certainly will continue.
The graph of Autralia's terms of trade (below) show the pattern of declining raw material prices since WWII, which changed some time in the early 2000s (assuming that our terms of trade is somewhat representative of the relative prices of raw materials and manufactured tradeable goods).
As a general rule, raw materials should become relatively cheaper over time as capital makes us more productive and raw materials easier to extract. This is always true even if there are natural barriers to resource extraction. Changes from this trend caused by a surge in demand are almost by definition temporary.
The generic argument is that China and India are making huge capital investments, thus they need a lot of energy and minerals. These countries are also getting wealthier and consuming more (and meat in particular). But the boom is driven by capital investment – building roads, rail, bridges, dams, buildings etc – which cannot be sustained for long at such a high pace.
Remember, this a change in relative prices, not quanitites. Prices can fall extremely easily with the smallest of changes to the volumes of minerals and fossil fuels being traded.
The RBA, however, seems to think this price structure will be sustained for some time even though it never has in the past - the natural limit for the terms of trade appears to be around 80.
My main concern is that frighteningly, the RBA, and probably much of the government, sees Australia’s future as a single bet on mining, and is willing to sacrifice much of the remaining economy for this to happen. Unfortunately this is a lose-lose proposition for most of the country.
All other sectors of the economy lose while the mining investment booms. When it crashes, we all lose because there is nothing else left in the economy to absorb capacity in a relatively short period. Remember, the minerals will be in the ground if we don’t mine them now, but the decades of production chains elsewhere in the economy are easily destroyed and slow to rebuild.
I acknowledge that the RBA has a single tool in its toolbox, but surely the message we should be hearing is that a strong and stable economy is a diverse economy. Quarry Australia is a very volatile and risky place to want to be.


