Monday, July 27, 2020

What is Gigi actually saying about COVID?


* Read Gigi's piece at The Conversation

Twitter is a mob, and the mob has a new enemy. Professor Gigi Foster has been on a few television shows lately trying to make the case that economic lockdowns cost lives, just as COVID does, and therefore we want to make sure that we aren’t inadvertently killing more people over the long-term by crushing economic activity and livelihoods.

After all, a functioning economic system is what delivers high-quality healthcare, safe roads and workplaces, investment in public works, the ability to devote resources to research medical treatments and new drugs, and more. It delivers livelihoods and careers, leisure and happiness. It delivers quality of life as much as it delivers quantity.

However, I don’t think gotcha television and infotainment current-affairs shows are the best venues for this discussion. From what I saw, these outlets were actively avoiding putting a number on the trade-off, or even acknowledging it. A cabal of social media economists avoided acknowledging this trade-off a few months back. They then back-peddled, said there was a trade-off, and botched their attempts to quantify it.

The puzzle to me is that everyone seems to want to say Gigi is trading off lives for the economy. Her point is that a functioning economy delivers health and welfare outcomes, and hence the trade-off is about lives for lives.

For some reason, saying this is a new taboo.

Policy decisions that explicitly make this trade-off occur all the time. Should we fund more medical research? Should we install traffic lights? Should we make people wear seat belts? Should we ban alcohol and cigarettes? Should we legalise recreational drugs?

Policy analysts, particularly economists, spend careers looking at these welfare and livelihood trade-offs in all sorts of policy domains.

When she says "man up" she means that we need to face up to the fact that we cannot create a pre-COVID world. There are going to be losses of life quality and quantity, either from the virus or our response to it.

I want to go through some of the strange things I see when talking about our COVID policy response, and some of the things people say to avoid facing the reality of this trade-off. My personal view is that the reasonable thing to do is to make sure our policy response does not shorten lives and reduce their quality more than COVID would. I hope that this helps people to understand where Gigi is coming from.

1. The exponential growth and tail risk story
One of the big claims early on was that those talking down the risk didn’t understand exponential growth. Strangely, exponential growth doesn’t usually apply to virus propagation. The pattern is well-understood to be logistic growth, which is going to saturate the population at some point. The unknown was merely where that point would be. An upper bound for that point was pretty clear early on based on evidence from China, Italy and the Diamond Princess cruise ship.

2. Virus prevalence estimates
How much of the population has been exposed to the virus? This is another area where the worst-case scenarios got all the airplay, and where more sensible estimates were ignored. The more prevalent the virus was, the lower the overall mortality. You can see the media incentive for publicising the high mortality estimates, even though it was known quite early on what the realistic estimates were.

3. Infection and case fatality rates
Initially, the highest estimates were promoted, but the reality is that the range of 0.25-0.65% for infection fatality is the current view. If two-thirds of the population is infected overall, that is a worst-case scenario of about 0.16-0.4% of the population dying from COVID, or a few months of normal deaths brought forward in time. This is a generous worst case. The "Swedish disaster" has seen a crude COVID death rate of just 0.05% of the population, under a third of my lowest estimate. 

4. Getting the orders of magnitude right
I asked my Mum when she was panicking about the COVID outbreak how many people she thought had died. She said 5.

When people tell me about the shocking number of COVID deaths I like to ask them how many people die each day in normal times. No one seems to know, or care.

Nearly 8,000 people die every day in the US. Fear does not care for statistics.

The 6,000 coronavirus deaths likely to come from the virus in Sweden are equal to around 24 days of normal expected deaths, and many of these COVID deaths are not in excess of normal deaths. 

A good rule of thumb is that 8 in 1,000 people die every year (0.8%), or about 60 million globally.

For perspective, the seasonal flu in Australia kills 1,500 to 3,000 people, with about 18,000 hospitalisations.

In Queensland alone last year 285 people ended up in ICU due to flu. 

5. Getting the cost of life right
Everyone dies, so dying of one thing today simply stops you dying from something else later. Deaths are life-shortening. In the trade-off I described above, economic recessions and lower future output are also life-shortening. There is no point talking about “prevented deaths”, only shorter lives (that whole quality/quantity thing). If people die a year to two younger than otherwise from COVID, then that’s not too bad. If they die 30 years younger than otherwise, the loss is fifteen times worse per death.

6. But what about transmission!
Another argument is that coronavirus can have lasting effects on some people. Yes. And? Others say that you might feel bad transmitting the disease to others. Yes. And? These issues are true of all viruses. They were true of last year’s record 1,300 flu deaths. There are hundreds of people out there who transmitted the flu virus to someone last year and it killed them. Where was the outrage then?

7. Or do recessions save lives?
I’ve heard the argument that recessions decrease traffic and workplace fatalities, reducing crude death rates. I can’t make a judgement about whether this is true, but it makes perfect sense and could be. But it only raises another question—if recessions save lives as a general matter, why aren’t we trying to orchestrate recessions all the time? If it is logical to do it for coronavirus, then it is logical to do it for traffic fatalities, workplace deaths, or whatever other indirect mechanisms of death are at play during economic expansions. 

8. The poorest countries suffer the most
There are global costs to lives from large scale lockdowns. Global vaccination programs for preventable diseases are being delayed, costing lives right now. Construction of health facilities is being delayed, costing lives in the future. Their general development and progress are hampered. Worse still, with very young populations, most poor countries have relatively few people at risk of COVID. 

9. The endgame. What endgame?
After a month of “flatten the curve” rhetoric, which basically had the right intention, there was a silent shift towards “crush and eliminate”. How does this make sense in a globalised world where the virus is going to saturate the rest of the world population? What endgame does that entail?

Being a national bubble with no international travel for years until a vaccine adds to the human cost of our policy response. If (or when?) the bubble is breached we get outbreaks anyway. New Zealand is hailed as a success on this front. But until when? The first person who arrives with COVID will simply take NZ back to square one. 

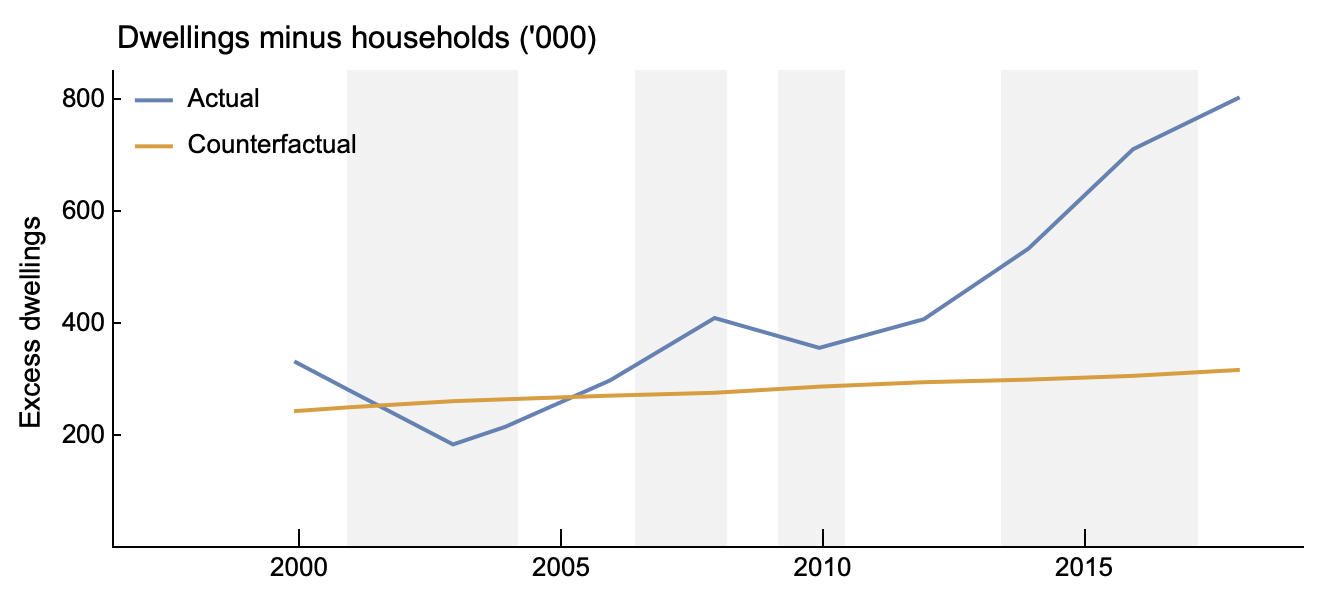
10. The counterfactual
This is tricky to consider. Is there a “no panic” counterfactual where the media doesn’t whip up society into a frenzy? I think there is, and this means that the “people would voluntarily lockdown” argument doesn’t fly. Why would they voluntarily lockdown?

The 2017 flu season was nearly 4x worse than the 2016 flu season, with 1,255 deaths compared to 464 the prior year.

In relative terms, the 2017 flu season was huge. It also had the risk of being multiple times bigger given the state of knowledge in the early stages. Yet no one panicked and shut down society.

If people don’t notice a 4x jump in flu deaths, would they notice a 10x jump from coronavirus deaths and voluntarily lock down? I argue they wouldn’t.

The “don’t panic, don’t lock down, invest in health resources” counterfactual is a plausible one. 

11. The un-science cancel culture
The Twitter mob has decided it can decide what is science and what is not, while at the same time attributing all variation in the COVID outbreaks across different countries or states to the policy response, leaving no space for randomness or luck.

This is “un-science”.

There is also nothing the un-science mob loves more than cancel culture. If my Twitter searches are anything to go by, plenty of people now want Gigi to be fired from her job. Yes, for raising the point that we should try and save the most lives possible by accounting for the cost to lives from our response to COVID, she is apparently now someone who can justifiably be cancelled.

12. A final thought
One thing I have learned to do to help maintain perspective is to turn a problem around and ask the reverse question. How many early deaths would we tolerate to avoid a large recession? Is your answer really zero? Even a global one?

How many early deaths do we tolerate by not spending more on the public health system? Where is the outcry?

[UPDATE]: After being hailed as a success story, on August 13 New Zealand went into a second lockdown after a new COVID outbreak—just as predicted would happen sooner or later. 

Sunday, July 19, 2020

Submission to NSW Housing Strategy

The New South Wales government is creating a long-term housing strategy. Hooray!

You can read my submission here.

What's the strategy all about? It's always hard to know with these jargon-filled government documents. To avoid accountability for specific outcomes these documents 1) never make direct, clear, points and 2) always use coded language.

To get a feel for what the priorities are in this strategy I did a word count of key terms that seem relevant to me when it comes to housing. If word frequency is any guide, the strategy is all about population, planning and supply.

Notably, it is not about prices.

This is weird. The Housing Strategy discussion paper notes that rents are the best metric for determining the adequacy of supply and that by this metric supply has been sufficient to meet the record population growth of recent years.
Given the large amount of housing supply currently being delivered, the vacancy rate has risen in Sydney and rent increases have moderated.
So we have a whole housing strategy being created on the basis that housing supply is not responding to population growth because of planning. Yet at the same time, there is a hidden admission that this is definitely not a big issue.

The only logical conclusion is that the government needs to be seen to be doing something about housing because of declining homeownership and enormous wealth gaps the housing market is creating. But it cannot actually enact policy to make housing cheaper.
The fact that community concern about rising prices is not the focus of the discussion paper is quite clear evidence of a political balancing act being played out. Housing is desired to be more “affordable”, but policies that actually lower home prices are political suicide and also come with macro-economic risks.
...current renters and future buyers are the main beneficiaries of lower prices. But they are few in number, and low in wealth, compared to the homeowners and housing investors who gain from higher prices and rents.
This is the heart of the NSW and national housing dilemma that should be the focus of any housing strategy at any level of government. A realpolitik view is that this dilemma is behind the promotion of supply-focussed policy—it can plausibly be claimed to be helping reduce prices while in practice not having any price effects, keeping homeowners and investors happy. In addition, it provides a justification for using the planning system to deliver windfall gains to politically connected landowner ‘mates’
There you have it. Expect a lot of talk and debate about housing during the development of this strategy. Expect no substantial changes except for a few more giveaways from the planning system to well-connected developer mates. 

Sunday, June 28, 2020

JG advocates want a UBI, they just won't say it

Let’s retire this debate and the endless word-games.

A Job Guarantee (JG) is a way to guarantee a certain income level to anyone willing to do tasks that some administrator decides are good.

A Universal Basic Income (UBI) is a way to guarantee a certain income level to anyone willing to do any task they decide is good.

We know that many JG advocates simply want to give people money for doing what they would do anyway if their income was guaranteed. They just have dogmatic beliefs about the dignity of work and the word "job."

Here’s Bill Mitchell saying that you would eventually do whatever you liked in the JG (my emphasis).
The Job Guarantee in fact provides a vehicle to establish a new employment paradigm where community development jobs become valued. Over time and within this new Job Guarantee employment paradigm, public debate and education can help broaden the concept of valuable work until activities which we might construe today as being “leisure” would become considered to be “gainful” employment.

So I would allow struggling musicians, artists, surfers, Thespians, etc to be working within the Job Guarantee. In return for the income security, the surfer might be required to conduct water safety awareness for school children; and musicians might be required to rehearse some days a week in school and thus impart knowledge about band dynamics and increase the appreciation of music etc.

Further, relating to my earlier remarks – community activism could become a Job Guarantee job. For example, organising and managing a community garden to provide food for the poor could be a paid job. We would see more of that activity if it was rewarded in this way. Start to get the picture – we can re-define the concept of productive work well beyond the realms of “gainful work” which specifically related to activities that generated private profits for firms. My conception of productivity is social, shared, public … and only limited by one’s imagination.

In this way, the Job Guarantee becomes an evolutionary force – providing income security to those who want it but also the platform for wider definitions of what we mean by work!
If we are going to be this lenient and generous with the definitions of a job, why bother at all? How about being a parent, carer, child, or just a citizen? Why aren’t these “jobs”? And if they are, aren't you just advocating for a guaranteed basic income of sorts?

The inflation concerns that JG advocates claim to have with a UBI are nonsense. They are just backfilling excuses. Obviously, most JG jobs wouldn’t in be sectors where output is priced, so wouldn’t enter inflation calculations anyway. Just like my housework isn’t priced, but could be if supplied by the market, a JG that includes my own housework would have no effect on reducing inflationary pressures.

Further, isn’t the insight of MMT that you might have to tax to reduce demand sometimes? In which case, a UBI can be easily designed to include taxes so that it redistributes in a way that doesn’t create demand-pull inflation.

Oh, and then there are people wouldn't participate in the JG anyway, like children, the elderly and the disabled. They would have to just get money anyway.

So let’s retire the debate. Yes, the government can be a money-creator if it wants. There are only real constraints. So let’s now talk about funding things that we think are important for society over things that are not. Let's talk about practical ways to redistribute income and wealth. Let’s get our priorities right and forget the word-games.

UPDATE: Despite all these nice words that have attracted many supporters to MMT, it turns out Bill Mitchell would like to scrap unemployment insurance from the welfare state and force people to take a JG job. He definitely does not want to give people money without workfare. 

Thursday, May 28, 2020

Submission to NSW Productivity Commissioner

Review of Infrastructure Contributions

Dr Cameron K. Murray
Henry Halloran Trust, The University of Sydney
May 2020

Download this submission as a pdf here.

Summary:

I argue that betterment is a more transparent, efficient, and certain tax base for raising council revenue for infrastructure or any other expenses. Compared to fixed-rate infrastructure contributions levied on a per-new-dwelling or per-new-building-area basis, a tax on betterment automatically adjusts to local economic circumstances, boosting efficiency.

I recommend the following:
a. Infrastructure contributions be scrapped in NSW.

b. Betterment from the planning system should be called “Community Development Rights” and a betterment tax should be implemented and called a “Sale of Community Development Rights”, or SCDR.

c. An SCDR be required at the time of planning approval.

d. The amount of to be paid for SCDR be calculated at 75% of the difference in site value when valued “at current use” compared to “at approved use”.

e. These valuations should be undertaken by a third party, rather than councils, such as by NSW Revenue using valuation expertise from within the State government.

f. Payment of the SCDR will be via
i. a 10% deposit of the assessed tax when planning approval is issued and,
ii. the balance on development completion (prior to registering the new plan).

g. For simplicity, in high-growth areas a schedule of pre-calculated betterment tax amounts on a per-dwelling or per-building-area basis can be published. These schedules will be produced by valuers based on local market conditions, borrowing from a process used in the ACT in 2012. 

Key points

1. The Terms of Reference for this Review are focussed on economic issues such as improved transparency, efficiency, and certainty of infrastructure contributions. These are desirable features of an infrastructure contribution system.

However, these are not the features of a system desired by those who pay them. If contributions are raised, even if levied in a more transparent, efficient, and certain way, I expect these economic objectives to suddenly become irrelevant to the development industry. This needs to be acknowledged up front.

The development industry mostly wants lower infrastructure contributions.

For example, Queensland implemented changes to tighten up and clarify its infrastructure charging regime in the 2009 Sustainable Planning Act. These changes ensured a tight nexus between the forecast costs of identified trunk infrastructure and the rate of the charge. These infrastructure charges were published in a simple schedule (an Infrastructure Charges Schedule) linked to a supporting document that identified the infrastructure upgrade and investments planned by councils (the Priority Infrastructure Plan). It was transparent, efficient and certain.

However, because many of these charges increased, rather than decreased as expected by developers, they then lobbied to have them capped, which was swiftly done by the Bligh government in 2011.[1]

2. There is a conceptual conflict between the idea that contributions reflect efficient costs while also complying with the principle of beneficiary pays. Benefits of infrastructure investment, as reflected in the value gains to nearby property, may be less or more than the cost of new infrastructure.

3. Betterment is the name for the value gain arising from increases in property value due to external factors, such as local infrastructure or new property rights granted to landowners through the planning system.

4. For property redevelopment, betterment is the value of the new property rights that allow for that development to take place, which are, until then “owned” by the community. We know this because redevelopment rights can be sold to property owners by councils, rather than given for free.

For example, in São Paulo, Brazil, auctions are held periodically to sell to landowners the rights to construct additional density, called Certificates of Additional Construction Potential (CEPACS), raising around $USD 200 million/year in revenue.[2]

Using betterment as a tax base can help side-step many of the technical arguments used against infrastructure charges on economic grounds. Just as property rights are sold at market prices from the public when disposing of land, property rights granted through the planning system can be sold at market prices.

5. Since 1971 the ACT has taxed betterment at 75% of its market value to fund territory government activities. Their system is known as a Lease Variation Charge (formerly a change of use charge). In addition, by being the monopoly developer of land subdivisions they gain 100% of the betterment in converting rural to urban uses.[3]

The below table scales up the revenue from these sources in the ACT for the difference in housing prices and new housing development in the other states, showing that if a similar scheme was enacted, over $18 billion could be gained by councils in other states using this mechanism.

In NSW alone, there was $8.2 billion of potential revenue in 2018-19.[4] Many other methods for capturing betterment for the public have been implements in Australian and abroad.[5]


6. This implies that over $12 billion worth of redevelopment rights, accrued to landowners in NSW at no cost through the planning system, were utilised in 2018-19.

7. From 1970 to 1975 NSW had a betterment levy of 30% of the value gain from the conversion of rural land to urban uses, raising $17 million in that time with $2 million in total administrative costs. This was used to finance the infrastructure necessary for expansion of the metropolitan region.[6]

However, political lobbying by wealthy landowners on Sydney’s fringe led to the demise of this funding mechanism.

In November 2007 the NSW Government foreshadowed a ‘Rezoning Infrastructure Contribution’ (also known as a ‘Staged State contribution’) to be paid either at the time of rezoning or at the time of sale. However, this approach was abandoned in the final package of reforms to developer contributions in NSW.

8. The beauty of using betterment as a tax base is that it prices property rights that are given away by the public that should be instead sold. The ACT system is equivalent to a 25% discount on the market price of the right to redevelop to higher intensity uses.

9. Additionally, like infrastructure contributions, the costs of a betterment tax or levy cannot be added to new housing prices. Instead, these costs are subtracted from the value of land prior to its development. On net, it is an economic transfer from current landowners to the community at large (via the council) that confers these new rights.

This is why the abolition of the Sydney Betterment Levy was such a political issue in city-fringe electorates—the value of the levy came off the value of the land with development potential.

10. Un-priced betterment is also the honeypot around which corruption emerges at both state and local levels. In most states, local councils have a history of corruption involving favourable rezoning and planning decisions. It is the fact that these decisions grant valuable new property rights for free to the recipients that fuels the corruption cycle. A recent example involves Casey Council in Victoria.[7]

A study I co-authored in 2016 showed that landowners in Queensland who were politically connected or employed profession lobbyists were much more likely to find their land within a rezoned area compared to near-identical neighbouring land, and in the process, these connected landowners gained $410m out of the $710m worth of development rights given to all landowners from these rezoning decisions.

UPDATE:
Certainty is greatly increased for the development industry by using betterment as a base for raising revenue as it solves the land purchase price dilemma. If planning outcomes are uncertain, the developer who is the most confident of a generous planning outcome will win any bid for the purchase of a development site. They will then require a generous planning outcome to justify the price they paid for the site. With a tax on betterment, they can pay only slightly above the value at its current use for the site. If they fail to get a generous planning approval then they pay less for the betterment tax. If they get a favourable approval, they pay more. 

Monday, March 30, 2020

Missing middle housing? Blame economics, not planning

A common objective of town planning schemes is the densification of existing suburbs to create “missing middle” density. This is usually enacted by allowing areas previously developed for detached housing to be redeveloped into incrementally more dense uses, such as townhouses and walk-up apartments.

But economic constraints, not planning constraints, are the main reason that this middle-density housing is missing.

First, in low-price areas, the per-unit cost of building higher-density dwellings may exceed the market value of a dwelling. Higher density dwellings are more expensive per unit to build (there are rising marginal costs to density), and they have a lower market value per unit. That is why you won’t see high-rise residential towers at the city fringe, or in small towns, even if they are allowed. Middle-density housing is also relatively more expensive per unit than detached housing.

Second, in high-price areas, if a site is worth redeveloping, it is probably much more profitable to redevelop to higher densities than the desired middle-density.

The diagram below shows the basic economics of this problem. If a single dwelling is built when the price hits P1, the existence of this dwelling makes the site much more expensive to purchase for redevelopment than a vacant site. You now have to bid against potential occupants of the existing detached dwelling to buy the site—effectively buying an extra house you don't want.


This additional cost adds to the redevelopment cost. In the diagram above, this shifts the average cost curve up from the orange line (the cost of developing a vacant site) to the blue line (the cost of developing from a site with an existing dwelling).

Between prices P1 and P2 the “missing middle” density is optimal (the marginal development cost per dwelling equals the price). But in this same price range, the average cost is above the price because of having to purchase the existing dwelling.

Thus, the existing detached dwelling “quarantines” a site from incrementally more dense uses. For example, demolishing multiple detached dwellings to rebuild a slightly more dense townhouse development is usually going to be uneconomical.

When prices are high enough to make redevelopment of detached housing into “missing middle” housing viable, these high prices are also going to make much more dense apartment towers even more profitable. In the above diagram, a price above P2 makes a tower apartment building the most profitable density.

The most economically viable locations to get “missing middle” density are actually in new fringe areas where low-value agricultural or industrial uses are being converted into residential uses. Perversely, it is the outer fringe where the “missing middle” is going to be most viable.

We can see this economic incentive at play in many large housing developments in fringe suburbs of Australian cities—these new suburbs now offer a mix of townhouses, small apartment blocks, and detached homes. In the inner suburbs, “missing middle” housing typically exists in places that were on the fringe of transit-constrained cities when they were built many decades ago.

Rather than fight against economic constraints, higher density in existing areas can be achieved with granny flats and other subdivision types that do not require demolishing existing dwellings. It is these alternatives that can be encouraged in the planning system.

Wednesday, March 25, 2020

A housing absorption rate formula—first cut

Housing supply is one of the most misunderstood processes in economics. The reason for this is that the core standard theory of economics is a static one-period model of production with a fixed capital endowment. They confuse the optimal density of dwellings, given the fixed capital of one unit of land, with the optimal rate of supply of new dwellings per period of time.

To be clear, the decision to supply existing housing to the rental market at any point in time is short-run production decision given a fixed stock of homes. That is why most homes that exist are not vacant. The marginal cost of renting (compared to keeping vacant) for a dwelling owner is typically far below the marginal revenue.

Building new homes is instead a capital allocation decision. Land and cash assets must be given up to build new homes. These assets earn a return over time and can be used in future periods instead of the current period. Building too many homes today depresses prices and rents, thereby reducing the return to both existing homes and homes you can build in the future.

So how is the optimal rate of new housing determined?

It is clearly not determined by the optimal density, as static models assume. Take a look at the figure below showing a housing subdivision in a street. The static theory says that if you approve a subdivision of five housing lots, you increase the rate of supply per period by five dwellings. They all sell in period one.

In reality, these dwellings do not sell all in period one (i.e. all in one day). They are drip-fed to the market over time, with one possible series of sales shown in the figure below. When I looked at the land banks of Australia’s top eight listed housing developers, the average age of their housing subdivisions and apartment blocks since their first sale, was ten years. The oldest was 25 years! They were still selling housing subdivisions approved in the last millennium. 


This slow rate is optimal because housing developers are rational. Selling faster reduces both the value of the rest of their subdivision and the growth rate of the prices they receive over time. They are giving up future returns if they flood the market today.

What do those future costs look like?

In the figure below we can see the effect of new dwellings sales on market prices and growth. The top line is the counterfactual price path if no new dwellings were supplied. Each additional dwelling when it is sold goes to the highest bidding buyer at that point in time, taking them out of the market and reducing the price to the second bid. This gap between the highest bid and next bid is labelled as alpha, and represents the “thickness” of the market in terms of how many people have bids clustered at the top of the curve. If you rank bidders from highest to lowest and get prices of 1.0, then 0.9, then 0.8, then alpha is -0.1 (the slope of this bid curve when buyers are ranked). If the market is “thicker” the bids might be 1.0, 0.95, 0.9, meaning alpha is -0.05.


Each sale at any point in time takes out a buyer and reduces the maximum price. Meanwhile, the other bids grow over time (or not) depending on macro and market factors. The next sale has the same effect, wiping off the next highest bidder and reducing the price, and so on.

So each sale has a pure price effect in terms of alpha. We can add these up on the above figure, and with a rate of sales of three per period, the price effect—the difference between the end of period price on the counterfactual end of period price is three times alpha.

This is standard economic theory, whereby increasing supply per period has a price effect. No surprise there.

But notice something else. The result of this pure price effect is that the price path is flattened compared to the counterfactual. Not only are end of period prices lower, but seen as a path, prices are growing more slowly.

The faster the rate of sales today, the lower future prices tomorrow. In essence, the pure price effect can be reinterpreted as a reduction in the growth rate of prices over time rather than a static price effect.

We can see this in the figure below where we reduce the rate of sales from three per period. Notice that the first lot is sold at a higher price because it is sold later, as is the next lot, with the third lot still to be sold at the end of the chart at an even higher price.


Somewhere between selling zero new dwellings, and selling enough to ensure that prices never rise above costs, is an optimal rate—an absorption rate that maximises returns to landowners from converting their sites to cash by selling lots to residents.

How should we think about what is optimal? Sticking with the basics, we can choose a rate of supply maximises the expected present value of the flow of lots into cash.

It is tricky to think of supply as a rate. But a simple logic can be used here to understand what is optimal. You want to at a rate that maximises the revenue this period and the value of the flow of revenue from all future periods, based on expectations and discounting. At this optimal point there is no gain from increasing the rate, since increase the rate comes at a cost of future price growth (and vice-versa).

The immediate revenue from the rate of sales is simply the price times the rate of sales. We can ignore the price effect in this because we capture it in the growth term which affects the value of future revenues (you can imagine supply as a sequence of sales, with any individual sale not having a price effect as it is the price setter at the margin at that point, but it reduces the price of the next sale in the sequence).

The value of the flow of future sales is the capitalised value of the end of period price, which is now lower because the rate of current sales has lower the growth rate.

As a mathematical approximation, we have the following equation to maximise (where I use f() to as a shorthand way to say this is some function of this term, but I’m not going to specify that function).


The maximisation happens when the marginal benefits from higher rates of supply today (the derivative of current revenue with respect to the rate of sales) equals the marginal cost in terms of lower value of future revenues (the derivative of the present value of future revenue).[1]

The rate of sales that maximises this value is


What is the intuition here behind the direction of the relationship between each market parameter and the rate of sales?

First, if the growth rate is higher, you need to increase the rate of sales in the next period to capture more of that value of that growth, which, because we are dealing with an instantaneous rate of sales, means increasing sales this period into the next period.

Second, a higher interest rate increases the rate of sales. This is because the future cost of lowering price growth by increasing sales is worth less today with a higher interest rate. A low interest rate means that the price effect on the future is more valuable today.

Third, the alpha term is negatively related to the optimal rate of sales. This makes sense. The thinner the market (the higher the alpha) the fewer sales can be made with the same price effect.

Notice how different this “optimal rate” thinking is to the usual economic analysis housing supply. This equation does not care how big your subdivision is—approving a larger subdivision won’t force anyone to sell or develop more quickly.

There is a lot more to this story. We actually don’t yet have an answer for how fast our five lot subdivision above should sell to be optimal. We know that if price growth and interest rates are low that they will sell lower than otherwise. We know if the market is thin they will sell slower than otherwise (say if they are in a small town compared to a large city).

I am working on a neat way to show the present-future trade-off, but it is not that simple. This might explain why theories of optimal rates of housing supply don’t really exist yet. There is a lot more to this mathematical story and if there are economic theorists out there who would like to help me ensure that my next “absorption rate formula” is consistent, please get in touch. 

_____________________
Fn. [1] I have taken a bit of liberty here to simplify the equation. Strictly speaking, the problem is a recursive one, in which the value of future revenue itself depends on future values. Also, strictly speaking, you could capitalise future incomes by the interest rate minus the expected growth rate, but this has problems. And, there are issues about the representative agent owning all the land, and whether you should account for the value of current housing or the value of the options for development in the price effect. The above equation is the simplest version that captures the direction of all effects and is the clearest way to show the future cost of faster supply.


Tuesday, March 24, 2020

Economic tide reveals naked policies


Superannuation

It seems that when people want to withdraw their money from super, the money is not there, and it requires asset selling that reduces asset prices across the board. This same effect happens ALL THE TIME. That is why a scheme that requires nearly 10% of wages to be spent on asset purchases is a bad idea, as it boosts asset prices. When the super system needs to pay out more than it gets in, asset prices are squeezed, and the value of what we thought we had saved begins to fall.

If only someone had warned about this.

Valuing life and the cost of lockdowns

Every policy involves trade-offs that can not only be measured in the monetary value of resources, but in blood. It is very standard to think of gains from health policy in terms of Quality-Adjusted Life Years (QALYs) as a metric of performance. Every public policy—from road rules to medical funding, to retirement, to workplace safety, to minimum standards—has an implicit trade-off of resources for lives.

Yet everyone has lost their shit about coronavirus as if lives lost this way are worth orders of magnitude more than lives lost any other way. In two to three weeks time the reality will set in that there are real costs of locking down society that can be measured both in value of resources wasted and in blood. All perspective has been lost at present.

Money was never an issue

Perhaps the greatest change from the crisis is that money was never a constraint. Politicians spend on things they like and don't spend on things they don't like. The budget was always an excuse.

I have often told policy advocates to stop arguing to politicians how cheap their solutions are to homelessness, or environmental losses, and other issues. They should instead argue how large of an investment is required to fix them! At the moment we are in a political vortex of one-upping each other in the ‘tough on the virus’ stakes, and this is coming with ever bigger cash splash promises.

But this is actually how things work all the time. Useless “ego-infrastructure” projects that give politicians a plaque and a ribbon-cutting photo-op are the norm. Big spending decisions are driven by political egos, not logical resources trade-offs. 

Housing was always a macro issue

I have heard for years from experts in my field of housing economics that zoning was constraining supply and rezoning would see a construction boom like never before. In fact, according to their numbers, we could double, or triple, the rate of construction by changing just a few words in a few town plans to allow higher densities.

But I have yet to hear rezoning proposed as the solution to the inevitable construction crash. Why not? Could it be that the argument was always bullshit and that housing supply is (you will never guess) constrained not by regulations, but by demand from new buyers? When buyers leave, construction falls.

This is not some radical “crisis-only” situation. This is always the case.

Sunday, March 22, 2020

A "Central Housing Bank" proposal for a crisis and beyond

Cameron Murray
Henry Halloran Trust, The University of Sydney
20 March 2020

Download proposal as a PDF
  • We propose that State governments (or Federal) create a “Central Housing Bank” (CHB) that stabilises the housing construction sector by swapping assets, in this case, cash, for new dwellings. Just as the Central Bank swaps cash for other financial assets to solve liquidity problems in financial markets, the CHB would do the same for one of the nation’s largest economic sectors. 
  • As a national program, a dwelling target for the first year could be 30,000 dwellings across the 20 largest towns and cities in the country (around 0.5% of the number of dwellings in these towns). This is roughly 15% of the new dwelling completions in 2019, a significant demand buffer for the housing construction industry, supporting an estimated 150,000 highly productive jobs. 
  • In balance sheet terms, these actions are costless for any government that undertakes them, as they receive a dwelling of equal (or perhaps higher) value to the cash they give up. Margins on housing development are typically above 25%, so this would be an opportunity for a public agency to engage in discounted counter-cyclical asset purchases to support jobs in the construction sector. 
  • The CHB can then use those acquired dwellings in a number of ways to support policy objectives, such as 
  1. renting in the private market to help stabilise rents, 
  2. using them for public housing at discounted rents, 
  3. selling to social housing providers at discounted prices, 
  4. or selling to the private market in future periods when prices are rising to dampen the housing cycle. 
  • Housing construction investment is a volatile, but productive, part of the economy, currently accounting for around 5% of GDP and 7% of Australia’s workforce (including housing construction and ancillary industries).
  • Ensuring continuity and utilisation of productive organisations, such as builders, manufacturers of construction materials, and the design and management professions, can help ensure productive capacity is maintained during the crisis, and in the post-crisis period.
  • The basic implementation of a CHB would be as follows:
  1. Employ a small group of senior construction and project management experts to manage the CHB, ideally from the non-housing construction sector, such as mining and oil (to avoid conflicts of interest). 
  2. This CHB team would request tenders from private housing developers or landowners to supply new apartments at an agreed price. The objective is to utilise the pipeline of already approved housing developments to speed up the process. In Sydney alone, there are an estimated 20,000 approved yet not-yet-commenced dwellings. Nationally, the top eight housing developers have a landbank of over 200,000 apartments and houses. There is a massive pipeline of sites that the private sector has queued up for housing that they will be looking to sell to reduce exposure to falling land prices. 
  3. They could also shop for development sites as a market participant. 
  4. The CHB management team would be incentivised to meet dwelling supply targets both in terms of the quantity delivered, and the location-adjusted average price paid. Independent assessment by State Valuers, in conjunction with State or Federal Treasury, can determine the value for money and hence the performance bonuses of the management team. 
  5. Rough annual new dwelling purchase targets for the CHB could be set as a schedule across major towns and cities in proportion to their population, for example, 0.2% of the population in every town or city above 100,000 residents (of which there are 20 towns and cities nationally). Expansion to smaller towns can be conditional upon the success in the first three years of the CHB. This would be roughly 30,000 dwellings in the first year. 
  • There are enormous macroeconomic stabilisation benefits of this system. The accumulated stock of rental housing owned by the CHB can be used to dampen housing price upswings by introducing a selling rule. For example, if dwelling prices begin to rise above a set rate, of say 5% per year, this would trigger sales of the stock of dwellings held in that region to private sector buyers at the rate necessary to keep growth below the target rate (again, like Central bank intervention to stabilise interest rates), absorbing speculative demand and stabilising housing prices.
  • This system is not dissimilar to housing systems in Singapore, and public housing systems in Europe, and previous housing systems in Australia and North America.

Monday, March 16, 2020

Economic crisis? How about ‘equity mate’?

During 2009 farmers were paid $61million per month in drought assistance as part of Exceptional Circumstances Subsidies. But the public got nothing for it.

I have often said that public subsidies, even in a crisis, should always come with obligations. The simplest of all is to make the subsidy an asset swap rather than a gift—provide the cash, but take an equity stake in exchange, diluting ownership. This 'equity mate' public policy can help ensure the continuity of productive capacity during crisis periods.

Central banks provide liquidity via asset swaps to financial institutions in exceptional times. 'Equity mate' is just a way to provide cash via asset swaps to the companies that do the actual production in the economy. 

But in practice, this is not easy.

In a crisis, the value of equity falls. By taking a new equity stake when the value is low, you are providing much less cash per share while diluting an already lower equity value.

How this could work in practice is to have a “standing facility” whereby a rule about the value of equity the Treasury or Central Bank would pay is set in advance, and businesses can choose to use it up to a maximum share, of say 10% of the business value. As an example the rule could be:

For listed companies, equity comes at a price of the lower of—
  1. The middle of the price range of the two prior years, or
  2. The middle of the price range of the prior year, or
  3. The current price plus 15%.
For unlisted businesses, equity comes at a price of—
  1. The average of the marked-to-market balance sheet from the two prior years.
These rules would have to be broadly considered, but you get the idea. When equity values are rising, the price paid would be too low compared to the option of expanding cash for investment by issuing equity to private investors. Only during downturns would this kick in, when sudden declines in economic activity spook the market as a whole. Having this option in place might also dampen selling during a crisis, just like the government guarantee on bank deposits deters bank runs. 

This ‘equity mate’ injection of funds is a way to provide liquidity insurance to our productive enterprises without massively changing their incentives. A problem with drought assistance, for example, is that the expectation of future subsidies gets capitalised into the value of farmland. The insurance is free, and the incentives to invest in a way to mitigate loses from predictable rain variation are reduced. 

Buying up the nation's companies in a downturn is also just a smart investment. Buy low, sell high, make money. In the 2008-09 financial crisis, the Reserve Bank of Australia used counter-cyclical investment in currency to stabilise the dollar. It bought a lot of AUD using its USD reserves when the AUD fell to below USD0.60. In the following years, the AUD increase to above USD1, making a large profit for the Bank, which is an income for the public sector. Like this example, counter-cyclical purchases of a small public stake in a wide range of companies will provide future public revenues. 

What are your thoughts?

Sunday, January 12, 2020

The easiest retirement system - Retiree Tokens


People are often confused about retirement income systems. Understandably so. Most economists, and organisations such as the IMF, OECD, national treasuries, and think-tanks, have promoted a view that countries that rely more heavily on taxation and transfers to facilitate retirement incomes (pay-as-you-go systems) are at an economic disadvantage compared to countries with “pre-funded” systems. The aggregate value of assets held in pension funds is believed to measure a country’s capacity to support a retirement income system. More funds, more capacity.

But this is wrong, and it is easy to demonstrate why.

All retirement income systems merely allocate goods and services to the retired at the time they are needed. They only differ in terms of the accounting system used to implement them. Some use public finance and cash transfers, while others, such as superannuation, require compulsory asset transfers.

But the problem of allocating goods and services to the retired does not necessarily need any accounting system at all. Just make a law that requires all retailers to supply their products to people over retirement age for free. Voilà. Retiree incomes, in terms of the goods and services they consume, are automatically and immediately guaranteed.

When a retiree fills their car with fuel, there is no charge. When they shop at the supermarket, again, there is no charge. When a customer reachers their magical retirement age birthday, their electricity and gas bills go to zero. New clothes? Free for the elderly.

This system redirects real resources to the retired. The cost is borne by the non-retired in the form of higher prices and hence lower real incomes. All retirement income systems do this — the non-retired have less ability to consume goods and services, the retired have more.

But, this "no accounting" retirement could be easily gamed. Retirees could begin to sell their free goods in secondary markets, on-selling to non-retirees to profit for themselves.

To fix this problem you could introduce a Retiree Token system. Each retired person gets a limited number of Retiree Tokens that they use at retailers to exchange for the free goods they are entitled to. This Retiree Token system would limit the ability for retirees to on-sell in secondary markets the goods and services provided to them for free. Hypothetically, you could provide each retiree with, say, 24,000 Retiree Tokens each year that they can swap at a 1:1 exchange rate to the dollar for the free goods and services that businesses are legally obliged to provide.

As you can see, a retirement income system can be achieved without any accounting system. It might be operationally problematic, and could be improved by using Retiree Tokens to limit the free goods and services that the retired are entitled to.

So if retirement income systems do not need money at all, where does that leave the idea of “pre-funding” a system? After all, there is no way to use financial markets to create more Retiree Tokens, just as there is no way for airlines to uses financial markets to “pre-fund” their frequent flyer token system.

The answer is simply that it is not possible to “pre-fund” a retirement income system. In terms of goods and services consumed by the retired, all systems possible systems are pay-as-you-go. There should be no confusion about this.

Monday, December 30, 2019

The puzzle of high home prices and vacant homes

One pattern that stands out in the property market is that although homes prices are at all-time highs, so too is the proportion of vacant dwellings. This is a puzzle. How can it be the case that when housing is in high demand it is also rational to keep more housing vacant?

Australian data shows that the number of residential dwellings has grown faster than the number of households for the past decade, indicating a substantial rise in the proportion of empty homes. This phenomenon has been a broad one, experienced in cities such as SydneyVancouver, and Toronto. Here are some of my previous thoughts on the topic.


The resolution to this puzzle is as follows. Housing is an asset, and in asset markets there is a trade-off between liquidity and returns. A vacant home is a more liquid asset than an occupied home. Timing a sale is easier, the sale is faster, and it is likely to result in a higher price when vacant. When capital gains are a large proportion of the total return, and capturing this return requires timing the market because of price variability, the value to liquidity from vacancy can be high.

In short, when yields are low and prices high and variable, the benefits to vacancy are high.

Here’s an example. In Scenarios A and B the total asset return to housing is 10%. But in Scenario A the price is high and yields are low. Here, leaving the property vacant forgoes only a quarter of the total return from the asset. If prices are variable in this Scenario, then timing a sale becomes an important factor for earning the capital gains. Hence, the liquidity from vacancy has a large benefit.

Return Cap. gains Rent
Scenario A 10% 7.5% 2.5%
Scenario B 10% 2.5% 7.5%

In Scenario B the price is low, as the rental yield is 7.5% of the price. Capital gains are also low at 2.5%. In this low price, low capital gain, scenario, keeping the property vacant requires giving up three-quarters of the total return. The benefits from doing so are limited since capital gains are low, and hence less variable.

So there is an economic logic behind the puzzle of high prices and high vacancy, and it stems from the fact that housing is an asset as well as a consumption good. But there is also a criminal logic. Much of the vacant housing in Australia (and probably Canada and a few other locations) is due to money laundering. There are no checks on the source of finance for home purchases and no checks on who the ultimate beneficiaries are in the ownership structure. You can buy a home in a trust or company name, and the identity of the trustees and the company owners need not be disclosed. If you then also do not earn rental income, the corporate structure is protected from scrutiny by tax authorities. Housing is a great way to hide ill-gotten gains.

The criminal logic and economic logic are closely aligned. When most of the return to housing comes from capital gains it makes housing a more attractive place to hide money as three-quarters of the total return can still be had. But when most of the return comes from rent it is much less attractive — and it may require corporate disclosure due to local incomes warranting taxation.

Finally, some new data
On another note, new data from the Australian Bureau of Statistics came out recently, filling one of the holes in the housing data landscape — the share of lending to investors that is directed towards purchasing or building new homes.

This data helps to answer questions about the economic value of new credit in the economy, the real economic effects of monetary policy, and more. In standard economic thinking, low interest rates make borrowing to invest in new buildings and equipment more viable. Because standard economic models do not include secondary markets, the effect on the trade of existing assets is mostly ignored. Yet we can see that the majority of home purchases are simply trades of existing housing, and hence are a key mechanism through which low interest rates mostly cause higher prices without having much effect on new construction.
As you can see in those few months of investor data,  investor lending is not substantially more biased toward new housing than lending for owner-occupiers. For investors, 24% of loans have been for new housing in the past few months, just as 24% of loans to owner-occupiers have been.

The main difference seems to be that the typical existing home bought by owner-occupiers is more expensive than the typical new home, whereas for investors the mean value of lending to both is the same. 

Monday, September 16, 2019

Rent control is totally normal price-cap regulation

Bernie Sanders has smashed the Overton window. Rent control is going global.

Unfortunately, this means that the economics 101 brigade has come out in force to smugly Vox-splain their incorrect model of rent control and housing market dynamics.
Regulating housing rents makes economic sense because homes are attached to land monopolies. Monopolies are inefficient, and regulations can improve outcomes. The two classic regulations are 1) a tax on monopoly super-profits, which is common for mineral and energy resources, and 2) a price cap, which is usually applied to network infrastructure, like rail, electricity, and water. If price caps sound to you a bit like rent control, then you would be spot on. They are rent control.

Rent control is not weird or unusual for regulating monopolies. The weird thing is that land is no longer considered a form of monopoly.

Let me explain how these two classic regulations would work in housing markets to socialise monopoly profits from housing locations.

A super-profits tax would work like this. When a new home is constructed, the owner would be able to seek the market rent. That first year’s market rent would become the regulated price that would attach to that home in a rental database. The home would still be allocated in the rental market using open market prices. But any gap between the market price and the regulated price would be 100% taxed. This is shown in the figure below.


If the market price fell below the regulated price for some reason, that loss would accumulate as a credit against future tax obligations when the market price increased again.

With a super-profits tax system housing resources, including new construction, are always allocated by market prices.

Since the financial crisis, rents have increased by roughly 25% in the United States. A quick guess-timate suggests that around a trillion dollars of rents are paid in the US each year. Had such a tax been implemented ten years ago it would now raise about $250 billion a year with no efficiency loss. In Australia, total housing rents have increased from around $30 billion to $45 billion in that period, meaning a housing super-profits tax would now raise around $10 billion per year (after adjusting for the increased housing stock).

The second way to regulate the land monopoly in the housing market is with price caps (rent controls). Here, the sitting tenant is protected from price increases that are not the result of additional housing investment or renovation but arise due to the favourable location-monopoly of the owner.

As before, market prices match tenants to housing and provide incentives for new construction. However, a sitting tenant is protected from price increases that arise from the location-monopoly. This only works if their tenure is secure, and they cannot be evicted as a way to change the rental price back to the market price.

The image below shows how the gap between market price and rent-controlled prices is a transfer to sitting tenants. If market prices fall below the regulated price, the tenant can have the option to renegotiate or move to pay the lower market price. Again letting markets decide resource allocations. It is only in periods of rapid price growth that sitting tenants are protected.


On balance, this type of regulation transfers some monopoly super-profits to tenants in the short-term but gives them back to owners as tenants relocate and homes are again allocated by market prices.

Either system of regulations will socialise some of the monopoly rents in housing markets. In fact, it is widely acknowledged that a reduction in volatility of returns can accelerate new housing investment. Recent studies also show that owners of older housing choose to accelerate redevelopment into more dense housing if their rents are regulated.

Both regulations are common in other monopolistic sectors of the economy. The main issue is that these regulations will transfer billions of dollars of value away from landlords, and landlords won’t like it. And the economic 101 brigade will always find a way to argue that policies to help the poor are bad for them.

Sunday, September 8, 2019

Housing subsidy and UBI confusion

When the Australia government introduced a cash grant for first home buyers, the aggregate effect was to increase home prices by roughly the amount of the grant, quickly negating its effect on affordability.

This observation has led many people to mistakenly believe that giving cash grants in any form will pass through one-to-one into higher home prices (or rents). In discussions of all types of welfare—from UBI, to traditional welfare payments—this error comes up.

The error comes about because people fail to see that when given a choice, people spread their extra buying power across all the different types of goods they consume. An income subsidy is not the same as a subsidy for a particular type of expenditure.

Economists have been studying the way spending patterns vary with income for over 150 years. Ernst Engel noticed in 1857 that as incomes rise, households spend a lower proportion of their income on necessities like food. This observation became known as Engel’s Law, and the income-spending relationships for different goods became known as Engel Curves.

Housing, like food, is a necessity. As such, the share of income spent on housing usually falls as incomes grow. The Australian data shows that even for private renters—where one would expect competition from higher-income renters to bid up housing rents—the share of income spent on rent falls from nearly 50% of gross income for the lowest income quintile households to just 13% for the highest-income households.


This data might seem to imply that it is possible for up to 50% of a cash welfare payment to “pass through” to landlords for low-income households. But remember, this is not the marginal amount that would come out of extra income. Because the share of spending on housing falls as income rises, the spending on housing out of the extra income must be far lower than the average. In fact, across income quintiles in Australia, the marginal additional spending on housing per dollar of additional income sits tightly in the 5-7c range. It may be possible that long-run adjustments mean that more than this marginal amount is spent on housing out of extra income, but it will always be less than the average amount.

The story is rather different, however, if welfare payments are tied to a particular type of spending. This even more important in the case of housing, where the total stock changes extremely slowly and where landowners have monopolistic incentives to prefer price gains over investing in additional supply.

An example is if everyone received a fixed $1000 per month that could only be spent on housing. Because this money cannot be spread across the consumption basket, people would soon learn that they are best off using it to bid up the rent to access their preferred housing location. The macroeconomic reality is that this additional buying power will chase roughly the same number of dwellings, increasing their price.

The difference between a “general income subsidy” and a “housing expenditure subsidy” can be shown using Engel curves. The chart below shows three Engel curves for a household, with the orange representing housing. Blue represents other normal goods, where expenditure rises with income, but a bit faster than for necessities (as per Engel’s Law). The green curve is an inferior good. Household spend less on these goods after their income reaches a certain level.


A “general income subsidy” shifts the household up to a higher income level, and they spend more on all the types of goods in their consumption basket. The effect on housing expenditure is relatively small, as expected by our previous 5-7% assessment of marginal housing expenditure.

The next chart shows the effect of a “housing expenditure subsidy”. The total income of the household is unchanged. They are only able to direct the subsidy towards their housing expenditure. Here, the effect will be to boost buyer competition for scarce housing locations and increase home rents (or prices). This was the case with the first home buyers grant.


Though it is tempting to see them as quite similar, subsidising household incomes and subsidising a particular type of expenditure have rather different economic effects. 

Thursday, August 15, 2019

Microeconomic success, macroeconomic failure

When I teach macroeconomics, I use a dog and bone analogy to demonstrate that the macro-economy is not equivalent to just “adding up” the micro.

Let’s see the analogy in action.

In the dog and bone economy, ten dogs repeatedly try to find nine bones buried in the yard. Each round, at least one dog misses out. We think that this outcome is undesirable— we can’t have an economy with over 10% dog “bone poverty” and perpetual “dog unemployment”!

Some astute dog economists notice that dogs that miss out on a bone are usually a little slower, or have some other traits that make them relatively poor performers. They reason that there is a “skills mismatch” that, if corrected, could solve the macro-economic problems in the dog economy.

These economists go the extra mile and conduct some randomised controlled trials on interventions that seem promising.
  1. Give the dogs that miss out a head start
  2. Provide the dogs that miss out advice about where to find the bones
  3. Train the dogs that miss out to sniff out bones better
After trialling each of these interventions, the results come in. They are astounding!

In each policy experiment, dogs that missed out on finding a bone 75% of the time in the control group only missed out 5% of the time in the treatment group.

The researchers responded to media enquiries about their results. “This is the largest effect I’ve ever seen in a social science intervention,” they said.

If it can be replicated at scale, the experimenters may have hit on a powerful new tool for dismantling bone poverty in the dog economy. Policymakers are now looking to invest in expanding these programs in dog parks across the country.

I don’t know about you, but it always helps me to understand what is really going on when we talk in the abstract. In the dog economy, it is clear that regardless of the microeconomic success of these interventions, there is still going to be “dog poverty” and “dog unemployment” because of the macroeconomic conditions. There are always nine bones and ten dogs. At least one dog still misses out and experiences “dog poverty”.

Helping someone jump the queue for access to scarce resources is obviously going to help that individual. But it can’t help everyone in the queue.

And yet, these microeconomic “queue-jumping” policies are politically attractive. Job training is widely thought to be an important tool for solving unemployment. But if the unemployed are competing over scarce jobs, then job training can only change the preferred ordering of candidates.

A recently popular policy in this vein has been “intensive housing counselling”. This involves lobbying landlords on behalf of housing voucher tenants and advising these tenants to move to “high opportunity areas”. Not surprisingly, these tenants took up the professional advice and assistance given to them.

As one tenant noted, after deciding where they would like to move, the housing counsellors “pretty much took care of the rest. I gave them my information, they gave my information to the leasing office, they applied for me, and they helped with the first month’s rent and the renter’s insurance for a year.”

Making renting and finding a home easier is great. I’m not going to argue against that.

But what puzzles me is this. Like the nine dogs and ten bones, not everyone in a “low opportunity area” can move to a “high opportunity area”. And in fact, as people start to move out of these “low opportunity areas” those areas will have even fewer economic opportunities for residents that ultimately move into them! The policy can’t “add up” to the macro, despite its success at the micro-level.

So what sort of policies do work at a macro level?

In the dog economy, the thing that works is to compress the “bone distribution”—take the nine bones, cut off one-tenth of each bone, and let the ten dogs access 9/10ths of a bone each. Alternatively, have a handler keep some bones in reserve to share amongst the dogs that miss out. Macroeconomic success requires a mechanism that changes the nature of the game itself, rather than the individual behaviour within it.

Sunday, July 21, 2019

Two problems with opportunity cost

If there is one idea that defines economics, it is opportunity cost. Unfortunately, muddled thinking about this idea means that across the economics discipline it is applied rather inconsistently. Economists often use the word to mean whatever they want it to mean. 

In its most basic form, opportunity cost just means your next best alternative use of resources. What opportunity did you forgo to undertake this action instead of an alternative? But it gets much more difficult to translate this idea consistently into more detailed economic theories.

I want to highlight two big inconsistencies with the use of opportunity cost in economics. To do that I want to start with a question that triggered a mini-controversy in the discipline a few years back when it was revealed that economists did worse than chance in answering a multiple-choice textbook question about opportunity cost.

The question was:
You won a free ticket to see an Eric Clapton concert (which has no resale value). Bob Dylan is performing on the same night and is your next‐best alternative activity. Tickets to see Dylan cost $40. On any given day, you would be willing to pay up to $50 to see Dylan. There are no other costs of seeing either performer.
What is the opportunity cost of seeing Eric Clapton? A. 0, B. 10, C. 40, D. 50.
According to the textbooks, the answer is B.

There are two mistakes here.

Comparison with different costs

First, the two given alternatives have different resource costs. If you see Dylan you have $40 less to spend. Therefore, a clean comparison of opportunity costs requires us to compare these alternatives

A. See Clapton for free.
B. See Dylan that night and have $40 less to spend.

If we don’t account for the full costs of each alternative, we end up with ridiculous scenarios, like comparing the profit from investing $1m with the profit from investing $1k. It makes no sense when we abstract into raw financial terms, and it makes no sense here either.

Strictly speaking, the correct answer is $10 minus the net benefit from my next best use of $40. But then again, maybe I don't know what opportunity cost is either!

Alternative options are not discrete

Another problem with opportunity cost is that, in reality, there is a continuum of alternatives to any action. The next best option to Alternative A is usually doing Alternative A but cutting some corners slightly. In this case, if seeing the Clapton concert is Alternative A, then seeing Clapton and going to the bathroom when your favourite song is played might be a “next best” alternative.

We could, if we want, break out any of the discrete alternative actions into an infinite array of alternatives. Each of those could be broken out again until we have a continuum.


If we zoom in on this continuum, then the opportunity cost is always equal to best Alternative, and even the opportunity cost of the best Alternative is itself.

This point is important. If, for example, we think that supply curves include opportunity costs of resources, then economic profits are always zero or below by definition.

In a topic I study, property markets, this is also important. Many people think that the second-best alternative use of land sets the price. For example, in regard to the price of land for housing:
…in the absence of any restrictions on supply, the price of raw land on the fringes should be tied reasonably closely to its value in alternative uses, such as agriculture.
Why is agriculture the next best alternative to housing? Surely there are multiple residential subdivision options that are alternatives, and some will be better than others.

Property valuers (appraisers) are clear that the value of property rights comes from its highest and best use, but for some reason many economists think they know better. Valuers test out the various legal options for land use to determine which one provides the highest value to land, and it is this use that determines its value.

The opportunity cost logic, in this case, becomes more absurd when we think about the case where there are three possible legal uses of land—say agriculture, industrial, and residential (in order of value). If the second-best alternative sets the price, then you can make the land cheaper by regulating against the second-best use of industrial development, making agricultural use the second-best alternative and decreasing land prices for housing.

And I haven't even considered the case when there is only one allowable use of land. Doesn't this make the second-best use to do nothing, therefore bringing the land price to zero?

Like many seemingly insightful economic ideas opportunity cost is less powerful than it appears and often confuses more than it clarifies. 

NOTE: Here are some recent articles that follow up on the original survey question that show just how varied the interpretations of opportunity cost can be.

Monday, June 10, 2019

The bathtub analogy of housing supply

Many people hold the view that rezoning land to allow higher density residential uses on each plot will accelerate the rate of city housing development.

I think this is wrong.

The main reason I think this is because there are a finite number of new buyers per period, and residential developers are not in the business of competing with themselves on price. No sane developer floods the market with new housing just because the regulations are changed to allow them to build 100, rather than 50, homes on their lot. In fact, they might just build at the same rate on that lot for twice as long before moving to the next location.

A key confusion in housing supply and zoning discussions is that density limits per lot are interpreted incorrectly as a constraint the rate of new housing supply per period. New homes per lot is not the variable of interest in city housing supply. New homes per year across all lots in a city is the critical variable.

Zoning constrains the location of different densities of housing, but not the total rate of supply across all lots in a city. [1]

In the past, I have tried to dispel some of the key problems with the standard static economic models that conflate the allowable density per lot with the rate of supply. This is what I said then about these models 
The only problem is this. When you convert the model to English you realise it has little basis in reality. The only real pattern that is consistent with the model is that higher buildings are near the city centre. But I could come up with a million other models that are consistent with that pattern.

One of the main flaws in the AMM model is that there is no possibility for development of sites within the city into new buildings. Every site is already used at its optimal level. There are no vacant sites or sites with old buildings ready for knock-down and reuse. There is no development industry. There are no landowners.

Also because of the comparative-static nature of how the model is used, every time there is a marginal change in any of the parameters of the model — a new person moves to the city, the rental price of the second best land use increases, or the efficiency of construction methods change — the whole city is wiped clean of homes and buildings. The single social planner who controls everything in the city then dictates that the whole city will be rebuilt with a new optimal allocation of housing and commercial buildings under new conditions, and this whole new stock of buildings rebuilt in an instant to that new specification. 
In that blogpost I introduced some new ideas about how to conceptualise regulatory constraints using this diagram.

I want to now offer a simple “bathtub” analogy that demonstrates why our thinking about housing supply and zoning is often misguided. 

Imagine a city region is like a bathtub. The limit on total development, if every location was used to its highest-value use, is the depth of the tub. This is affected by geographic, regulatory, and economic constraints. The water level is the current total stock of housing across the city. Lastly, the dripping water from the tap is how fast new development is occurring across the total city to increase the total stock of housing. 


The question is, what part of this bathtub situation would you address with policy changes to increase the depth of the water? The depth of the bathtub, or the rate of water flow from the tap?

Changing the depth of the tub is a bit like rezoning the whole city for higher density. It seems intuitively like a good idea, but if the city is nowhere near its bathtub capacity, what mechanism is there for this to affect the rate at which the tub gets filled?

The more effective approach is the look at the tap, and the rate at which new housing is developed. This can involve a few things, like making it more costly for landowners to delay converting land into higher-value residential uses. Or, it can mean redirecting credit flows into new, rather than existing housing, to encourage new supply. Regardless, when you start to look at the tap you see that the key variable that needs to be tweaked by policy are the dynamic incentives of landowners—delaying, or slowing, development needs to be made relatively more costly.

However, when you start to focus on the rate of supply you realise that the challenge of tackling price booms with supply is far from as simple as they seem. To even maintain the current drip feed rate of new housing requires a substantial portion of the workforce, and it doesn’t change the total stock very much (just a couple of per cent per year).

In Australia, for example, our housing tap drips at a rate that is around 2% of the total stock, and it requires something like 5-7% of the workforce to build at this rate (and more in some cities with high rates of housing construction).

To have a meaningful effect on the total stock housing, and therefore the price, requires an economically significant long-term construction boom. For example, increasing the rate of new supply by 50% for a decade—employing more than 7.5% of the total workforce instead of about 5%—will increase the total stock by just 9.8%. By any metric, this will have a price effect in the range of 5-15%. The point being, the large changes in the rate of supply have small effects on the total stock and these require a large share of economic resources shifted away from current uses and towards housing construction over a long period, particularly in boom cities.

Now, I am totally supportive of a sustained effort to build more housing to provide more options for households. But I am against pretending that rezoning means that developers voluntarily, and dramatically, increase the rate that they supply new housing to such a degree that they subsume a substantial portion of the workforce while at the same time reducing the price of the asset that earns them a living.

To change the rate of supply requires changing the dynamic incentives of landowners by making it relatively more costly to delay new housing development. This cost to delay means that bringing forward development, even if a lower price must be accepted, becomes viable. These types of changes will be labelled as punitive by landowners, but that’s how you know they are effective—it forces them to build housing when they prefer not to.

Finally, we can always create non-market housing institutions that build new housing regardless of market conditions, allowing this organisation to actually build at a rate that will depress prices, or offer housing to residents at below market prices.

With a bit of luck I hope that in future conversations about housing supply and zoning that the rate of new housing supply per period across all lots is no longer conflated with the allowable density of housing per lot.

fn. [1] I do note that some cities may very well have planning regulations that are so poorly designed that they do in fact constrain the rate of supply.

Update: Total employment in housing construction reduced to remove the engineering construction workforce.